A Market Timing Report based on the 10-21-2016 Close, published Sunday October 24th, 2016
I deliver focused comments on the markets. These are supplemented with “Tweets/StockTwits” (see links below).
1. SP500 Index: The big number this week is the first estimate of US 3rd Quarter GDP on Friday, October 28th (please read more on this in my update to last week’s post – link to the upper right). It could “spook” the markets if it radically disappoints. Earnings are mixed thus far with some strong results coming from Microsoft and Netflix among others. This week will be very busy with Earnings Reports. We can say from the market timing chart that the market is not overly impressed by earnings reports, especially with the background of election jitters.
SP500 Large Cap Index (click chart to enlarge; SPX, SPY):
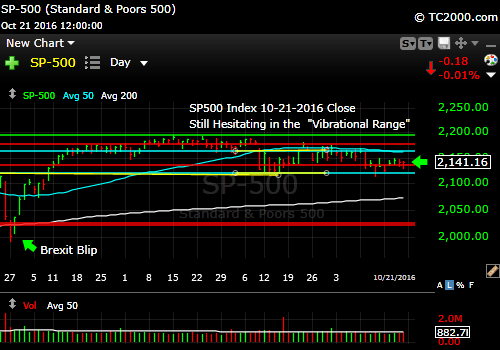
Markets still waiting for election results.
Keep up to date during the week at Twitter and StockTwits, where a combined 21,063 people are joining in. Thank you for your interest!
Twitter® Follow Me on Twitter®. Follow Me on StockTwits®).
Survey Says! Sentiment this week among individual investors (AAII.com) showed a Bull minus Bear percentage spread that was -14.08, or moderately Bearish in the midst of continued election results uncertainty. The percentage of “Neutrals” is just below 40% this week (above 40% Neutrals is Bullish on a market timing basis for higher prices out 6 months from today per AAII studies of their statistics). This degree of Bearishness can worsen further as extremes often hit 20-30% in the Bull minus Bear percentage spread.
| 10-19-16 12 am close to poll | Bulls 23.74% | Neutrals 38.45% | Bears 37.82% |
Interestingly, we were at about the same negative sentiment level back in 2012 at this point in the election season. We were at -15.9% on Oct. 18th, 2012. Back in 2008, on Oct. 15th, sentiment was at +1.2%, but that was in the midst of the Great Recession and it had swung to -29.4% on 10-08-2008 and went more negative to -32.8% on Nov. 19.2008 after the election.
This time around, we know what we are going to get roughly with each candidate. As I’ve said, like it or not, the stock market favors Clinton, so a Trump victory would be expected to cause the most upset to stock market investors, despite the fact that Trump has said he’ll do some things that would help companies tremendously, such as lowering the corporate tax rate to 15%.
2. U.S. Small Caps:
Small caps have tracked large caps very closely since the Sept. high, but I expect them to be more vulnerable as the economy shows signs of slowing. Have a look at where they are…
Midcaps have very slightly underperformed, but are better valued than are small caps. All categories are testing an important low. A close below these lows would bring on additional significant damage.

Large, mid and small caps are tracking fairly closely from last high.
Russell 2000 U.S. Small Cap Index (click chart to enlarge; RUT, IWM):

Small caps are near a significant low.
3. Gold: The dollar has kept moving up and the first time it rallied, gold fell (see the move I marked with the magenta line, but this last dollar rally leg is finding gold (orange line) RISING in price, which I marked with the yellow ——— line. That may mean that the higher rates the Fed is threatening are enticing dollar buying, but not everyone is “buying” that the dollar is the place to go, and gold is benefiting a bit. This is a VERY early trend (dollar up AND gold up), so we’ll have to see if it continues next week. “Gold up and dollar up” is NOT a good combination generally and often relates to panic in overseas markets.
Here is the comparison chart first, then I’ll show you the GLD chart:
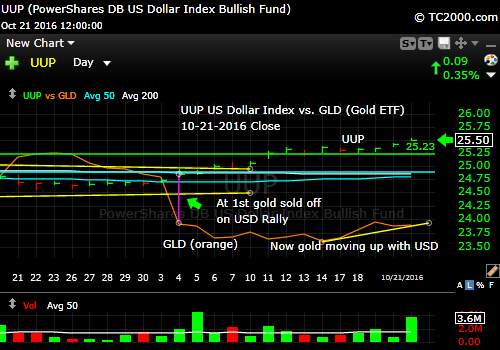
Dollar up gold down at first but now it’s dollar up AND gold up.
Gold buying in other currencies helps most when it’s being bought in several major currencies, as explained HERE.
Gold ETF (click chart to enlarge the chart; GLD):
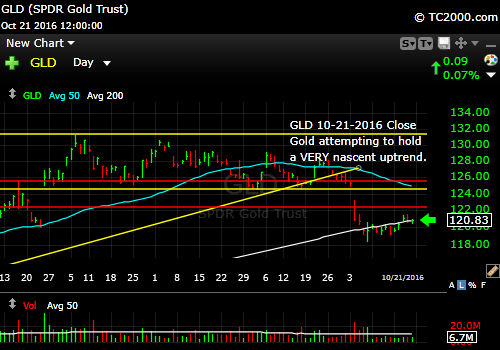
Gold easing UP a bit. A very early up trend.
4. U.S. 10 Year Treasury Note Yield (TNX):
Rates have now reversed the prior breakout. I expect them to fall further as the Fed is forced to back off of their assumed December rate hike. If they make a policy error and do HIKE in fact, they will likely have to reverse the error in short order. There is no chart that helps us predict Fed errors.
Remember I am not talking about what I would have done had I been running the Fed. “Fed errors” refer to their internal inconsistency. They claim to be data dependent, but don’t seem to see that the economic cycle is starting to reverse. The consumer will find out many months later.
If the market in fact believes the Fed’s intention to continue to raise rates, the breakdown in the breakout I’ve shown you below should be immediately reserved next week. This COULD happen if GDP surprises to the upside. The Atlanta Fed is currently predicting Q3 GDP to be 2.0%, down from their early Aug. estimate of 3.6%. They are well below other forecasts, so the market could be disappointed on Friday.
U.S. 10 Year Treasury Note Yield (click chart to enlarge; TNX,TYX,TLT,TBF):
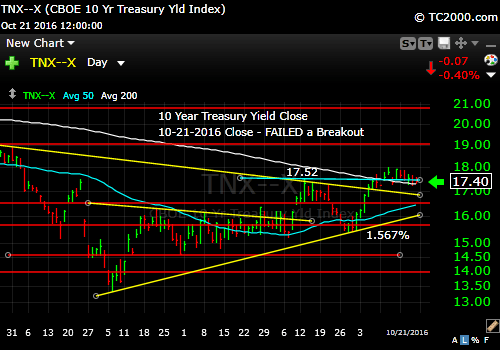
Breakout reversed and rates falling again. We’ll see if it continues into and past the GDP number out Friday.
Be sure to check StockTwits/Twitter as well, as I’m about to post a chart showing the relative performance of indices from around the world. Find out what the winning market is since the SPY high of 219.60.
Stay with me throughout the week for the LATEST via the links to Twitter/StockTwits above. Feel free to ask me questions, comment, retweet etc.
Note that ALTHOUGH my newsletter is now CLOSED to new subscriptions: You can Join the Wait List to Receive the Newsletter as a Loyal Subscriber, Opening again for the January 1st issue. Note that if you join and don’t read the newsletter, you will be deleted. Why? I don’t publish to non-readers as other newsletters do. I surround myself with committed people who value what we are doing. Stay tuned here in the meantime and follow all the action via the Twitter® and StockTwits® links above.
Be sure to visit the website for more general investing knowledge at:
Standard Disclaimer: It’s your money and your decision as to how to invest it.
I thank Worden Brothers for the charting system I use to post these charts. If you want to know more about the charting system I use every day, go to my “Other Resources” page here: Other Resources It makes it much easier to follow along with me if you can see the charts and manipulate them on your own computer. It’s a great investment to have an excellent charting system. Check it out with a free trial at the link above.
Copyright © 2016 By Wall Street Sun and Storm Report, LLC All rights reserved.
