A Market Timing Report based on the 10-28-2016 Close, published Sunday October 30th, 2016 – Updated 10-31-2016 and 11-01-2016
UPDATE 11-20-2016 11:16 am: Protect short term trading profits here. Could sell a bit and rebuy retracement from here or hold if you are not a trader. Gold is extended at the moment. Remember that the intermediate term should still be UP as the Fed will have to pivot to more dovish whether it hikes in December or not. See chart on StockTwits/Twitter posted just now.
11-01-2016 How is the GLD Trade Working?
I outlined this trade yesterday, to buy a breakout above 121.59 as noted just above the GLD chart posted in the Sunday report (scroll down). The follow through today was strong, and we’ll see if this holds up. I would plan on keeping at least a small part of your profits should GLD pull back and retest this breakout. I am keeping a strong core GLD position in light of the Central Bank shenanigans that are going on worldwide. Gold is a form of currency protection.

GLD trade on breakoout is working thus far.
And now for this week’s market timing brief…
I deliver focused comments on the markets. These are supplemented with “Tweets/StockTwits” (see links below).
1. SP500 Index: First, we’ll consider the GDP data out this week and then get on to the Clinton email shocker. Market timing is thrown for a loop when big wrenches are thrown into the charts.
The first estimate of third quarter U.S. GDP came out on Friday morning and initially received a favorable reaction until it was realized that there was weakness beneath the headline. That included talk of how soybean sales had goosed the export number and how inventory building also falsely raised the GDP number. Building inventories while consumption falls is not a recipe for corporate profits. Personal consumption was in fact down from 4.3 to 2.1 the previous quarter. Here are the raw numbers for the data lovers: GDP data.
First let’s look at the quarterly GDP data. Remember that real GDP (headline figure quoted as 2.9%) is the seasonally adjusted annualized rate of growth predicted from growth during the third quarter. It’s an attempt to answer the question “What would the growth rate be for the coming year given the growth in the economy this past quarter?” This graph, based on questionable inputs noted above, says the growth of the economy has picked up.

Headline GDP number (SAAR; see text above)
What about the Year over Year data? My message on StockTwits included a link to the year over year GDP data: HERE. There was a blip up from 1.3% Year over Year GDP growth to a 1.5% rates of Year over Year GDP growth, which Bulls could say shows some promise of more. Bears would point to how close it was to the last number and the softness of the third quarter number just released. Take your pick. My take is that the economy, although growing slowly, is still growing and not necessarily headed into recession.
Given the slow growth rate, the Fed will only make things worse by raising rates, but it appears they are willing to make their second policy error since the last one in Dec. 2015. It’s an annual tradition now. That will further slow the economy incrementally though perhaps not fatally, the Bulls may argue, but there are other signs in the economic data that point to further economic slowing in which case ANY further rate hikes would be ill advised.
Should rates be higher? Yes, but now that we’re here, what we should expect from the Federal Reserve is internal consistency with what they claim their goals are.
What else happened on Friday was the second version of the Clinton email investigation, when Comey sent a letter to Congress saying that his finding new emails linked to Clinton on Anthony Weiner’s laptop meant they had to investigate them, but did not know what they’d find…just 10 days before the election. The 1 minute chart I published on StockTwits was publicized Friday night shows just how the market reacted to the email announcement and can be seen HERE.
The market took less than 5 minutes to react to the tweet from Congressman Jason Chaffetz (UT) who broke the news on Twitter. Some said that there was earlier information on the Comey letter, but I have not yet confirmed it. The stock market fell on the news, because as I’ve been saying for several weeks, the market wants a Clinton win but NOT a clean sweep of Congress, because it does not want a liberal agenda to be swept through Congress, and it does not want sweeping trade treaty re-negotiations and possible trade and tariff wars to follow.
Follow the election, because the market certainly is!
There is a warning sign from the end of the week as shown on the small cap chart, so after reviewing the SP500 Index chart, take a look at the small cap market timing chart…
SP500 Large Cap Index (click chart to enlarge; SPX, SPY):

Stocks sink to support after FBI letter sent to Congress.
Keep up to date during the week at Twitter and StockTwits, where a combined 21,226 people are joining in…here:
Twitter® Follow Me on Twitter®. Follow Me on StockTwits®).
Survey Says! Sentiment this week among individual investors (AAII.com) showed a Bull minus Bear percentage spread that was -9.32, or still somewhat Bearish in the midst of continuing worries about who will be our next President. The percentage of “Neutrals” is just ABOVE 40% this week (above 40% Neutrals is Bullish on a market timing basis for higher prices out 6 months from today per AAII studies of their statistics). The modest Bearishness is not as predictive as the neutrals are. For that reason and others (some mentioned above), we will remain long stocks, but not overexposed to them. We never make market timing decisions solely based upon sentiment, but are vigilant at the sentiment extremes.
| 10-27-16 12 am close to poll | Bulls 24.75% | Neutrals 41.18% | Bears 34.07% |
2. U.S. Small Caps:
Small caps are indeed starting to break down on a market timing basis through an important support level. There is a catch though, which I show you in the second chart below this.
Russell 2000 U.S. Small Cap Index (click chart to enlarge; RUT, IWM):
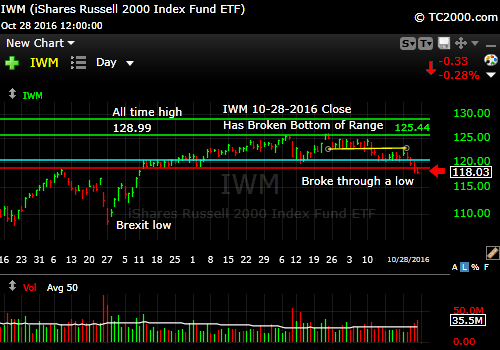
Small caps bust through support.
How are Small caps doing vs. Mid and Large?
U.S. Large Caps (SPY) vs. U.S. Mid Caps (IJH; white line) vs. Russell 2000 U.S. Small Caps (IWM; green line; click chart to enlarge): Note that the small cap line (green) has further to fall to catch up to the other two indices, so that even though small caps have broken a support level, they have more gains to give up than do the mid and large caps. I still favor large and mid cap stocks over the intermediate term.
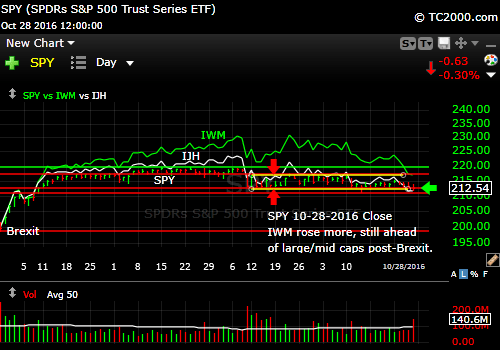
Small caps are still ahead post-Brexit, but they always fall more, rise more.
3. Gold: The dollar has been very slowly and slightly moving up with gold on a market timing basis, but after the GDP report, the US dollar fell and gold rose. It’s always easier for gold to climb if the dollar is falling, and both tend to rise together mainly during panic. The election uncertainty should give gold some upward tone. Still, it tested and failed to rise through the yellow resistance line (121.59) shown.
Given the recent behavior around the number noted above in parentheses, I would consider a breakout above there to be a potential buy signal. Set a stop on new positions in case it turns into a fake out.
Gold ETF (click chart to enlarge the chart; GLD):
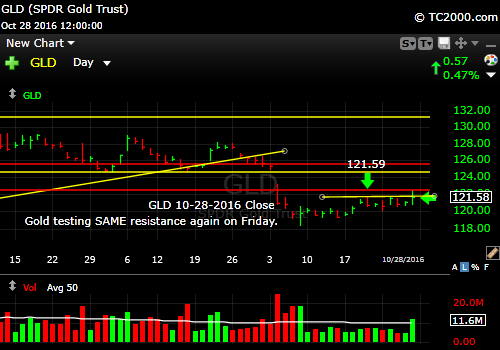
Gold still has upward tone.
4. U.S. 10 Year Treasury Note Yield (TNX):
Rates have now reasserted the prior market timing breakout. There is still fear that the Fed will raise rates at least in December. They have a meeting that ends on Nov. 2nd, but there is no dog and pony show (news conference) until the December meeting. They won’t want to raise rates a few days before an election. They won’t change too much in their statement either in my opinion, or that could equally upset the markets. Then we have the employment situation report on Friday at 8:30 am. Check in this week with me on Twitter/StockTwits to keep up with the news.
U.S. 10 Year Treasury Note Yield (click chart to enlarge; TNX,TYX,TLT,TBF):
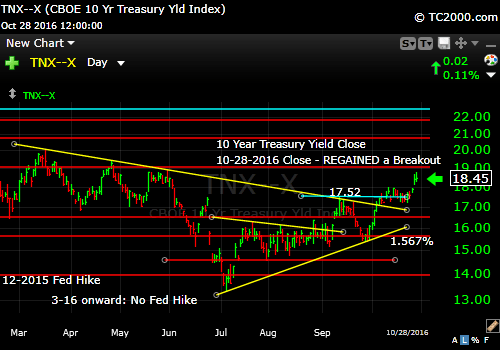
Fear of Fed hikes starting with December.
Stay with me throughout the week for the LATEST via the links to Twitter/StockTwits above. Feel free to ask me questions, comment, retweet etc.
Note that ALTHOUGH my newsletter is now CLOSED to new subscriptions: You can Join the Wait List to Receive the Newsletter as a Loyal Subscriber, Opening again for the January 1st issue. Note that if you join and don’t read the newsletter, you will be deleted. Why? I don’t publish to non-readers as other newsletters do. I surround myself with committed people who value what we are doing. Stay tuned here in the meantime and follow all the action via the Twitter® and StockTwits® links above.
Be sure to visit the website for more general investing knowledge at:
Standard Disclaimer: It’s your money and your decision as to how to invest it.
I thank Worden Brothers for the charting system I use to post these charts. If you want to know more about the charting system I use every day, go to my “Other Resources” page here: Other Resources It makes it much easier to follow along with me if you can see the charts and manipulate them on your own computer. It’s a great investment to have an excellent charting system. Check it out with a free trial at the link above.
Copyright © 2016 By Wall Street Sun and Storm Report, LLC All rights reserved.
