A Market Timing Report based on the 11-25-2016 Close, published Sunday November 27th, 2016
I deliver focused comments on the markets. These are supplemented with “Tweets/StockTwits” (see links below).
1. SP500 Index: SP500 Large Cap Index (click chart to enlarge; SPX, SPY): Stochastically, the market can be seen to be stretched at the moment (not shown). If you did not add when I did prior to the election, you were not fully on board for the rocket trip up after the election. That’s OK, but now it’s more tricky to add exposure. My thesis was that the market would dive post-Trump, but that it would be a buying opportunity. I did not know that the swoon would be confined largely to the overnight futures and pre-market. It was. There was a small discount (drop left) by the open on Nov. 9th and then up the market went. In fact, the market (SP500 Index) began to bounce on a market timing basis on the day before and the day of the election, then it pulled back in the futures, opened a bit lower than the prior day, and then the Trump Rally was fully on.
Now you’ll have to add on pullbacks or find stocks or markets that have not yet fully participated in the Trump rally. I’d be cautious of those sectors that are doing poor post after Trump’s election, as the under-performance could continue.
Chair Yellen of the Federal Reserve will have no problem raising rates in mid-December. The stock market is doing well and can absorb the shock right? That is only true IF the economy begins to heal due to lower uncertainty about the future. That shift in sentiment would precede any real implementation of Trump fiscal stimulus policy. Remember however, that the market anticipates the future growth of revenue and earnings by a number of months. Follow the charts and follow the trajectory of the economy at the same time. It’s what I like to call “technofundamentals.” We will need both technicals and fundamentals to navigate this market over the longer term.
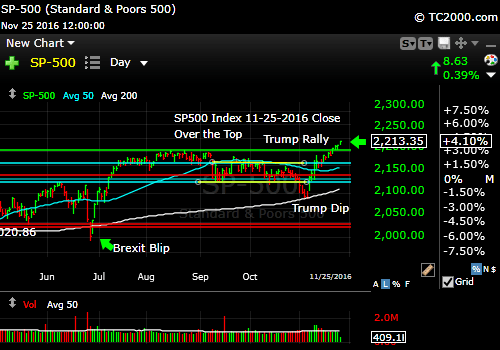
Trump Rally continues.
Keep up-to-date during the week at Twitter and StockTwits, where a combined 21,879 people are joining in…
Twitter® Follow Me on Twitter®. Follow Me on StockTwits®.
Survey Says! Sentiment of individual investors (AAII.com) showed a Bull minus Bear percentage spread of +27.81%, again up from the prior week, when it was only +20.08%. We are now getting close to the top of the typical spread seen near the highs of market swings, which is a move to 20-30%.
This is from last week: “The last higher surge of sentiment than the 11-05 number occurred with the 2-19-2015 report date’s surge to +29.1%. The next highest was on 11-04-2014 to +37.6%. See the recent pattern? November surges. In 2013 there was an October surge to 31.6% and then a December surge to +36.5% at the Dec. 26th report. I expect this sentiment surge to continue at least to the 29% level from here. Trump Fiscal stimulus is on the way, which is like ‘Christmas for the Markets.'”
I also said (and it’s still true): “The percentage of ‘Neutrals’ is far BELOW 40% this week (above 40% Neutrals is Bullish on a market timing basis for higher prices out 6 months from today per AAII studies of their statistics).”
I still believe this as said last week: “I think that means that we should expect another dip or two in the next 6 months. These may be more shallow than before.” If you want to enter this market, do so on pullbacks, not rips. Market timing your entries is important.
| Thurs. 12 am close to poll | Bulls 49.89% | Neutrals 28.03% | Bears 22.08% |
2. U.S. Small Caps: Once again, the small caps are at a new post-election market timing high and at an all time high. They are very stretched at the moment, and earnings will have to pick up to justify the rally that has already occurred. Read my post from last week to understand the reason why small caps are finding favor post Trump: HERE.
Russell 2000 U.S. Small Cap Index (click chart to enlarge; RUT, IWM):
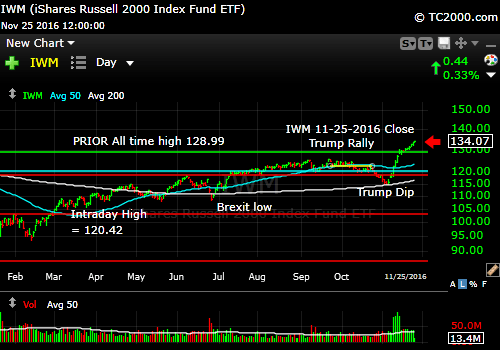
Another all time high.
3. Gold: Gold was already on its knees post-Trump’s election, and last week the trade broke down. You should already be out of your trading gold position. We still had a nice profit on gold you hopefully bought on my signal just after my 1-29-2016 report. You must use market timing for your trades in gold in my opinion. Not doing so does not recognize that it comes into and falls out of favor. I still hold GLD as currency insurance, but not as a trade for now. I’ve gone over what makes gold shine. Read it HERE.
Gold ETF (click chart to enlarge the chart; GLD):
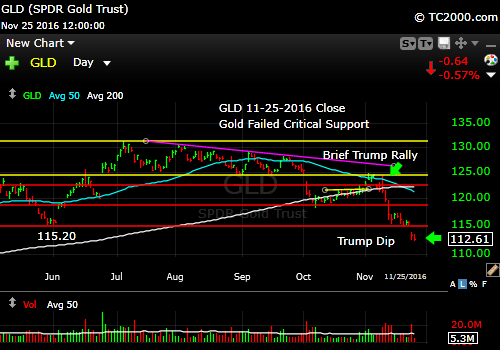
Gold trade breaks down.
4. U.S. 10 Year Treasury Note Yield (TNX): No new info since last week. Just a further VERY steep climb up in rates, perhaps ahead of reality at this point, but not a market timing trend we want to fight.
U.S. 10 Year Treasury Note Yield (click chart to enlarge; TNX,TYX,TLT,TBF):

Rates zoom higher again this week.
Stay with me throughout the week for the LATEST via the links to Twitter/StockTwits above. Feel free to ask me questions, comment, retweet etc.
Note that ALTHOUGH my newsletter is now CLOSED to new subscriptions: You can Join the Wait List to Receive the Newsletter as a Loyal Subscriber, Opening again for the January 1st issue. Note that if you join and don’t read the newsletter, you will be deleted. Why? I don’t publish to non-readers as other newsletters do. I surround myself with committed people who value what we are doing. Stay tuned here in the meantime and follow all the action via the Twitter® and StockTwits® links above.
Be sure to visit the website for more general investing knowledge at:
Standard Disclaimer: It’s your money and your decision as to how to invest it.
I thank Worden Brothers for the charting system I use to post these charts. If you want to know more about the charting system I use every day, go to my “Other Resources” page here: Other Resources It makes it much easier to follow along with me if you can see the charts and manipulate them on your own computer. It’s a great investment to have an excellent charting system. Check it out with a free trial at the link above.
Copyright © 2016 By Wall Street Sun and Storm Report, LLC All rights reserved.
