A Market Timing Report based on the 12-02-2016 Close, published Sunday December 4th, 2016
I deliver focused comments on the markets. These are supplemented with “Tweets/StockTwits” (see links below).
1. SP500 Index: The Federal Reserve will be raising the Fed Funds rate 0.25% come Dec. 14th as the economy continues to be on the mend. The probability of that per the CME Group is 92.7% as of Friday, pretty much a done deal.
Employment came in near consensus at 178,000 with 175,000 predicted @CNBC and 170,000 predicted @Bloomberg. Good enough for Dr. Yellen and crew to pull the trigger after waiting an entire year to make further rate hikes. I continue to be long, having gotten a bit “longer” on November 2nd, moving up to 100% of my usual equity exposure. After we review the large cap and small cap market timing charts, we’ll see which index is winning up to last Friday from the Nov. 4th low just prior to the election.
The Trump Rally may not stop here, if the market has really adjusted to the idea of higher interest rates. The problem with assuming that is the case is that we’ve never come off such a low level before. We don’t know if the loss of other factors that were prior tailwinds such as share buybacks using borrowed funds will or won’t damage the markets more than expected. If you add more here, be sure to use a mental stop loss on new positions rather than simply ride the market down. Next time, stay tuned in during the swoons and do your best to buy LOW not HIGH.
SP500 Large Cap Index (click chart to enlarge; SPX, SPY):

One more leg up or was that the end of the Trump Rally?
Keep up-to-date during the week at Twitter and StockTwits, where a combined 22, 063 people are joining in…
Twitter® Follow Me on Twitter®. Follow Me on StockTwits®.
Survey Says! Sentiment of individual investors (AAII.com) showed a Bull minus Bear percentage spread of +18.68% down from +27.81% last week. There is room to move in either direction frankly and the data is less predictive at the moment. The Bears are still fairly low in number, so there room for further recruitment there.
| Thurs. 12 am close to poll | Bulls 43.78% | Neutrals 31.12% | Bears 25.10% |
2. U.S. Small Caps: Small caps have been doing the best, but are pulling back a bit more than the midcaps as seen on the second chart below.
Russell 2000 U.S. Small Cap Index (click chart to enlarge; RUT, IWM):
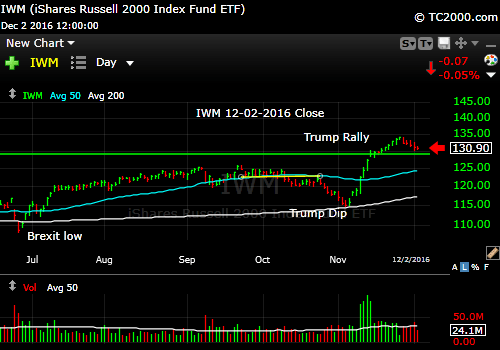
1st leg over?
Here’s the winner to date: IWM (small caps). Then IJH (midcaps). You can see that if you want large cap value, you might consider adding large cap tech (QQQ), but the strength of the U.S. dollar will hurt small and midcaps much less as their businesses are more confined to the U.S. than the large cap stocks, tech or otherwise, so diversification is important.

IWM leads IJH that in turn leads SP500 Index from the 11-04 low.
3. Gold: We’ve sold our gold trading position and maintained profits from our 1-29-2016 buy. I discussed what had to happen for gold to become stronger in last week’s post and on Twitter/StockTwits, so be sure to review that if you have not already read it (links to upper right for prior posts).
Gold can clearly slide further and erase the entire rally from last year. That’s why we do market timing and have a plan to always preserve some profits with gold and gold stocks. Trump’s spending and tax cut plans could give gold a boost eventually if they produce more inflation than growth, but that’s a longer term issue.
Gold ETF (click chart to enlarge the chart; GLD):
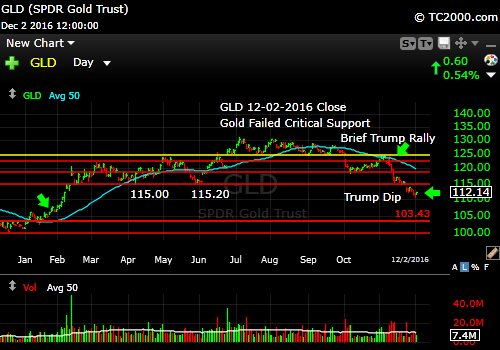
Gold broke support. Could retrace the entire rally.
4. U.S. 10 Year Treasury Note Yield (TNX): Rates are probably ahead of where the economy is right now. Some claim that GDP will slow badly into Q1 of 2017 and if that is the case, yields will fall again, perhaps to a higher low, but they will still fall, and gold will benefit.
Note that the 10 Year Treasury Yield hit the 2.489% mark and pulled back. That is a clear market timing resistance area and, if violated, it means another dose of pain for bond/treasury holders.
U.S. 10 Year Treasury Note Yield (click chart to enlarge; TNX,TYX,TLT,TBF):
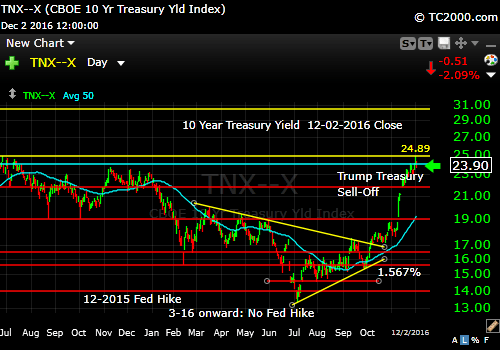
Rates pull off prior high.
Stay with me throughout the week for the LATEST via the links to Twitter/StockTwits above. Feel free to ask me questions, comment, retweet etc.
Note that ALTHOUGH my newsletter is now CLOSED to new subscriptions: You can Join the Wait List to Receive the Newsletter as a Loyal Subscriber, Opening again for the January 1st issue. Note that if you join and don’t read the newsletter, you will be deleted. Why? I don’t publish to non-readers as other newsletters do. I surround myself with committed people who value what we are doing. Stay tuned here in the meantime and follow all the action via the Twitter® and StockTwits® links above.
Be sure to visit the website for more general investing knowledge at:
Standard Disclaimer: It’s your money and your decision as to how to invest it.
I thank Worden Brothers for the charting system I use to post these charts. If you want to know more about the charting system I use every day, go to my “Other Resources” page here: Other Resources It makes it much easier to follow along with me if you can see the charts and manipulate them on your own computer. It’s a great investment to have an excellent charting system. Check it out with a free trial at the link above.
Copyright © 2016 By Wall Street Sun and Storm Report, LLC All rights reserved.
