A Market Timing Report based on the 12-16-2016 Close, published Sunday December 18th, 2016
I deliver focused comments on the markets. These are supplemented with “Tweets/StockTwits” (see links below).
UPDATE 12-30-16: SP500 Chart Update (Note: Next issue will be out this by the end of this long New Year’s weekend. See Twitter/StockTwits for most recent updates/links below…)
Santa came early this year. We are currently testing SP500 Index support at about 2244. This level should hold even if the test is a bit sloppy (by falling below a bit below support and then recovering), if the market’s assumption is that things will continue to improve under Trump. The market will need to see evidence of progress. I believe things will get better for a while, until it dawns on everyone that the U.S. debt level has risen enormously as a result of fiscal spending and tax cuts.
Rising rates may choke off the recovery at some point if real economic productivity is not raised as a result of the Trump policy changes. But in the meantime, I believe the market will continue to rise. Optimism has not topped out in my opinion. That is why I reported on Twitter/StockTwits that I’d bought several ETF’s and individual stocks (click the social media links below to see the charts related to my buys).
Keep up-to-date during the week at Twitter and StockTwits, where a combined 22, 449 people are joining in…
Twitter® Follow Me on Twitter®. Follow Me on StockTwits®.

SP500 eases after an early Christmas.
UPDATE 12-23-2016: GLD Market Timing Update: Gold has been in a down trend since the high of 130.51 on 7-07-2016 with steadily lower consolidation levels, each of which has been broken. The rally up to the election was quickly wiped away immediately after Trump won.
Growth is in and gold is out for the moment until all the spending involved in the Trump policies raises the inflation rate too high, even as interest rates spike, and the Fed attempts to contain it. That is why we hold gold as insurance despite the very poor trading behavior to say it nicely. See the comments on gold and support levels below as well. We should be down testing the 2015 lows soon.

Gold likely headed to complete erasure of 2016 gains.
1. SP500 Index: The Federal Reserve raised the Fed Funds rate 0.25% at their FOMC meeting that ended Wednesday to a target range of 0.5-0.75% (0.66% effective rate as of Thursday) and now says it will hike three times next year, whereas the prior plan called for just two hikes, so stocks paused this past week. The rally should continue as long as the expectations for economic growth and mild inflation continue. GrowFlation is OK as long as the inflation part of it is not too high and the growth is enough to grow profits again. We’ve been in a profit recession. If either growth prospects disappoint and/or inflation gets out of control, the trajectory of the markets will change. Longer term, if Trump decides to conduct debt driven fiscal policy, we may pay for it down the line in much higher interest rates.
My bias is to have the government support economic growth rather than create it artificially with borrowed money. Otherwise we become China. Fixing “infrastructure” may be necessary, especially if critical, but the debt does not help us unless the resulting spending contributes to the productivity of the real economy. Higher productivity is the only way wages and the quality of living rise as Chair Yellen has said at her Federal Reserve press conferences.
Trump may create lots of infrastructure jobs and be re-elected on that basis, but we need to ask whether the net impact is going to be positive or negative over the longer term. Again, it will work IF it contributes to productivity. Send your questions and comments directly to: @realDonaldTrump on Twitter. 😉
I added a bit more stock exposure this week (see social media links below). I have more powder should prices sink further.
SP500 Large Cap Index (click chart to enlarge; SPX, SPY):
(ignore the big volume spike Friday as it was “Triple Witching” day in the options market)
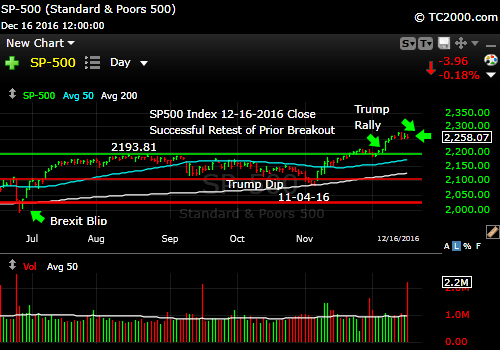
Trump Rally pause but still on track.
Survey Says! Sentiment of individual investors (AAII.com) showed a Bull minus Bear percentage spread of +12.33% down a bit from +16.63% last week.
The fact that Bears are being recruited before sentiment tops out means that there is further upside ahead, even if this “dip” continues.
| Thurs. 12 am close to poll | Bulls 44.66%% | Neutrals 23.01% | Bears 32.33%% |
2. U.S. Small Caps: Note the big surges of volume during this small cap rally. The last dip has been very minimal thus far in comparison to the huge rally from the pre-election pullback. The rally is still intact. Market timing signals are still in “go mode.”
Russell 2000 U.S. Small Cap Index (click chart to enlarge; RUT, IWM):
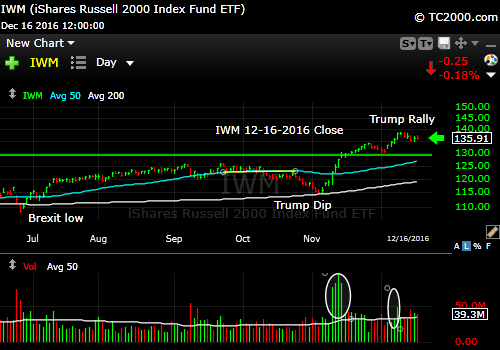
Minor pullback after a big run.
3. Gold: I’ll stand by my prior statement: “12-12-2016 Update: If the Fed indicates a steady progression of rate hikes from here [as it did in the Weds. FOMC statement], gold will retrace back the entire rally of 2016 (see chart below).” GLD market timing support below here is at 103.43 and 100.50. Buy some for Christmas, as it’s relatively cheap! But not for a trade at least until we hit bottom again or see a turn up.
Gold ETF (click chart to enlarge the chart; GLD)
NOTE Chart is from 12-16-2016 Close
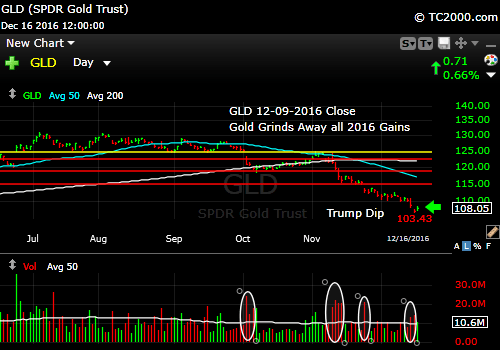
Gold giving up prior gains.
4. U.S. 10 Year Treasury Note Yield (TNX): There is more pain ahead for Treasuries. We have a brand new market timing breakout in yield. Follow the bouncing ball! Without a quick reversal, the 10 Year Treasury Yield is headed to 3%, likely with fits and starts, as usual.
U.S. 10 Year Treasury Note Yield (click chart to enlarge; TNX,TYX,TLT,TBF):
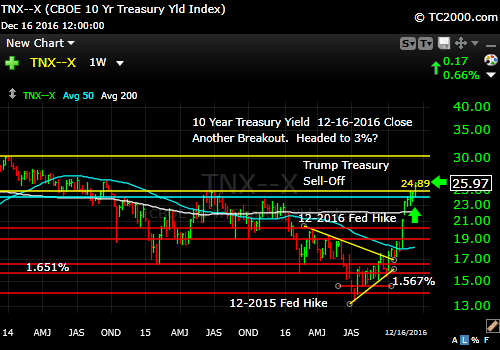
Rates headed to 3%?
Stay with me throughout the week for the LATEST via the links to Twitter/StockTwits above. Feel free to ask me questions, comment, retweet etc.
Note that ALTHOUGH my newsletter is now CLOSED to new subscriptions: You can Join the Wait List to Receive the Newsletter as a Loyal Subscriber, Opening again for the January 1st issue. Note that if you join and don’t read the newsletter, you will be deleted. Why? I don’t publish to non-readers as other newsletters do. I surround myself with committed people who value what we are doing. Stay tuned here in the meantime and follow all the action via the Twitter® and StockTwits® links above.
Be sure to visit the website for more general investing knowledge at:
Standard Disclaimer: It’s your money and your decision as to how to invest it.
I thank Worden Brothers for the charting system I use to post these charts. If you want to know more about the charting system I use every day, go to my “Other Resources” page here: Other Resources It makes it much easier to follow along with me if you can see the charts and manipulate them on your own computer. It’s a great investment to have an excellent charting system. Check it out with a free trial at the link above.
Copyright © 2016 By Wall Street Sun and Storm Report, LLC All rights reserved.
