A Market Timing Report based on the 12-30-2016 Close, published Monday January 2nd, 2017
I deliver focused comments on the markets. These are supplemented with “Tweets/StockTwits” (see links below).
UPDATE 1-04-2017: My Top Market Picks for 2017 (2-01-2017 – Further updated risk assessments after getting more information on Trump’s policy positions.)
Please note that these picks are based on themes that I see emerging from the current economic and political climate. There may be other valid themes. Look for them. Feel free to share with us below in the comments…
1. Energy and oil:
NOTE: Update 5-05-2017 The Energy Trades have been closed! Supply won over OPEC. US producers drove the price of oil below trend and that is the reason for my closing out the trades (results of which are posted on social media along with the oil chart; links below). The Biotech and Health trades are working well, but DO protect profits as outlined on 5-5-17 on social media as well.
This one is clear ([note to self: clear with risks = mud] with risks as outlined below given recent market action and Trump policy disclosures). It’s a clear technofundamental market timing signal. President Elect Trump will open up U.S. oil production like nothing before. That means supply, but it also means fewer impediments to the oil and gas industry. He will push for U.S. exports of energy products, while making sure U.S. prices don’t suffer too badly. OPEC is working on prices and made some progress recently. As long as WTI Oil holds the prior near month futures breakout (see chart below), the energy trade will move forward.

WTI Oil must hold the prior breakout.
I’ve already bought XLE and Chevron (CVX) to overweight energy in my portfolio. Don’t chase, but, rather, buy the dips. Yes, there is risk the support may not hold, so don’t blow all your powder on one trade. Today you could add to XLE or start a position on the oil pullback. You could even sell your position(s) if oil does not hold support. Your call there. I believe oil will work higher or stay steady enough to allow for oil companies to be profitable and that decreased regulations under Trump will also help them.
The risks? One risk is that oil prices decline on increasing supplies, which is why others are UNDERWEIGHTING oil and oil stocks this year. The other risk I see is that recent reports on traders’ positions have been overly Bullish on oil. When there are no more buyers, prices can fall. Remember that the ideas in this section are contrarian ideas that could degrade performance over the short to intermediate term. Most of my money is correlated with the general market (SPY, IJH and foreign country ETF’s).
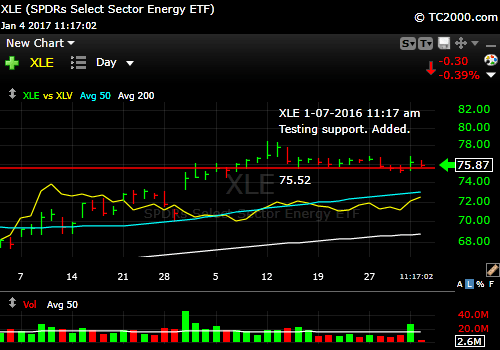
Holding support along with oil.
My 2017 Pick #2 is Biotech and drugs: This is yet another technofundamental market timing signal – also contrarian. Even Jim Cramer is anti-drug stock at this time (as of 2-01-2017 comments @CNBC). You’ll get more bang for your buck with biotech, but fewer dividends than with drugs/healthcare (XLV). I already own IBB via BIB (which has 2X leverage, so set your position size according to the risk). I’ll like be adding more biotech and/or drug stocks (follow my moves on Twitter/StockTwits).
The chart is coming, but first I want you to understand my point of view and how the market has not yet discounted it.
My thesis is that the market was right in the first place after the election when it bid up healthcare stocks. When it decided the demolition of Obamacare was a bad thing for the healthcare stocks, they pulled back, and about half the gains were lost.
My reading on Trump is that he wants people to have healthcare, and in much greater numbers than traditional Republicans supported in the past. He said, in fact, “we won’t let people die in the streets.” Trump is sensitive to public criticism and with healthcare, he’s more Democrat than Republican.
Obamacare will be gone, but:
1. People who already have coverage won’t lose it.
2. Trump’s administration will negotiate pricing with the pharmaceutical industry on drugs for Federal programs to lower healthcare costs, but he will be sure to keep biotech and drugs highly profitable. He knows these are jewels of American ingenuity and hard work that he can’t sacrifice. We lead the world in these industries.
3. Trump will otherwise seek to increase competition on healthcare pricing across state borders as he has promised and in ways he has not yet discovered.
Outright cures of diseases such as AIDS and Hep C have come from our companies. Abuses of companies such as Gilead (GILD) in overpricing drugs they’ve BOUGHT, not discovered, are the issue. Predatory pricing will stop, but profits won’t. We’ll be buying more healthcare stocks on pullbacks. They are a bit extended today, so we’ll wait to buy. I think the market is waking up to the reality of what Trump will actually do…
That means the next move for these markets will be UP. If not, we wait until the market sees enough of the reality of Trump health policies to bid up prices.
Remember, add on pullbacks, not on the big moves UP. As I wrote this, IBB rose from around +1.5% to +2.5%! We’ll add on the next pullback. If you want to add sooner, do so on what looks like an intraday dip.
Remember that both of these ideas are contrarian and could degrade the performance of your portfolio over the short to intermediate term. I believe my view on drug/biotech stocks is stronger than my view of oil stocks, due to oil pricing. Some would say the same about drug pricing risk, but I think what Trump will end up doing with the guidance of Congressional Republicans and drug company CEO’s is to strike a balance, so profits remain strong, despite price compromises. Volume will stay strong under Trump for the reasons I’ve outlined above.
As said, if you are not connected with me on social media (links below), you will be missing important signals…
Keep up-to-date during the week at Twitter and StockTwits, where a combined 22, 785 people are joining in…
Twitter® Follow Me on Twitter®.

Why we are going to overweight biotech and drugs under Trump.
Back to this week’s report….
1. SP500 Index: The Trump Rally has been on pause. The weakness in the SP500 Index is greater than that seen in the small cap market. It is of concern that the SP500 Index is now testing below support; however, support is just below the current level for the small caps as you will see in the second chart below.
Sometimes the laggard, which in this case is the SP500 Index, will test below support, while the leader holds support. I laid out the path for higher prices going forward in the prior post (link to upper right), so please read that. Trump promises must now be fulfilled at a reasonable pace or the market will fall in response.
The biggest 2017 Market Timing Risks for the stock market are:
- Failure of Trump promises to actually stimulate the economy or failure to do so in a timely manner.
- The Federal Reserve raising rates too aggressively via multiple rate hikes and slowing the U.S. economy and even counteracting the Trump administration’s attempt to stimulate it further.
- A major, expensive ground war against ISIS conducted by U.S. soldiers. Unlikely considering Trump’s attitude toward the spending on the wars in Afghanistan and Iraq.
- Repeated deadly terrorist attacks on the United States and Europe.
The recent Istanbul and Munich attacks are a big concern in regard to #4 along with the warning by our own FBI Director Comey that ISIS would metastasize at a faster rate as we shut them down in the Middle East. No need to live in fear, but we need to be vigilant and on the offensive in tracking down and shutting down terrorists. There will be an all out war via the internet by the Trump administration against the terrorists. He will massively increase the scope and aggressiveness of that which has been done to date.
Back to the fiscal stimulus question… In the end, any Trump programs that fail to increase the productivity of the U.S. economy will cause very short term economic growth that will fall off as the stimulus is withdrawn. We’d then end up with higher debt levels, a huge burden already for our children and their children, and nothing to show for it. Let’s hope Trump et. al. are smart about the use of “the People’s” money. Our money.
I bought the dip this week by adding midcap exposure (IJH; testing slightly below support, as well as XLE, the oil stock ETF. Please review my buys at either of my social media links below.
SP500 Large Cap Index (click chart to enlarge; SPX, SPY):
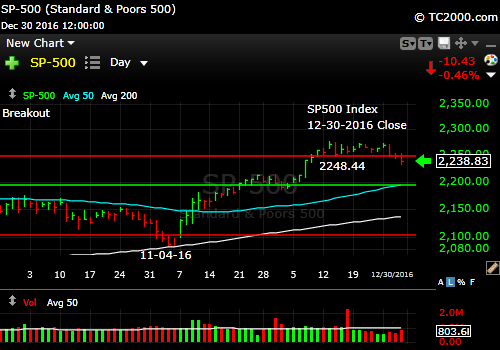
Below support, but the real leadership is holding support.
Survey Says! Sentiment of individual investors (AAII.com) showed a Bull minus Bear percentage spread of +19.83% up from +12.33% last week.
The current sentiment spread between Bulls and Bears can easily rise to the +30%-ish level or higher, but sometimes rallies peter out with sentiment spread at around 20%. Sentiment at this level is not that helpful to us in deciding where the market will head next. We will continue to add exposure in steps on pullbacks rather than chasing higher as is our custom around here. Yes there is obvious room for the market to correct further, but I expect the market to move higher for 2017.
| Thurs. 12 am close to poll | Bulls 45.57%% | Neutrals 28.69% | Bears 25.74%% |
2. U.S. Small Caps: The leader, small caps, are on support. Keep your eye on that ball. If they break (not just test briefly below support) on Tuesday, we will have another dip on our hands in the Trump Rally.
Russell 2000 U.S. Small Cap Index (click chart to enlarge; RUT, IWM):

Leader on support.
3. Gold: We’ve been on the right side of this pullback, fully out of our trading position. We own GLD as insurance only at this point. GLD just rose to and failed at first easy resistance. It is frankly more of a short on the bounces than a buy until the major trend changes. To do that, GLD must take out a number of the yellow-line demarcated market timing signals in the chart below.
Gold ETF (click chart to enlarge the chart; GLD)

Gold fails at easy resistance. Still weak.
4. U.S. 10 Year Treasury Note Yield (TNX): The failure of the breakout at the 2.489% level is encouraging to bond/Treasury Bulls certainly. Watch that level. If rates rise about there, we’ll have another leg up in the 10 Year yield toward 3%. If you are about to refinance or finance a house, you may want to consider waiting a few days to see what the market does at this key pivot point.
U.S. 10 Year Treasury Note Yield (click chart to enlarge; TNX,TYX,TLT,TBF):

Rates FAIL to hold a key breakout.
Stay with me throughout the week for the LATEST via the links to Twitter/StockTwits above. Feel free to ask me questions, comment, retweet etc.
Note that ALTHOUGH my newsletter is now CLOSED to new subscriptions: You can Join the Wait List to Receive the Newsletter as a Loyal Subscriber, Opening again for the April 2nd issue. Note that if you join and don’t read the newsletter, you will be deleted. Why? I don’t publish to non-readers as other newsletters do. I surround myself with committed people who value what we are doing. Stay tuned here in the meantime and follow all the action via the Twitter® and StockTwits® links above.
Be sure to visit the website for more general investing knowledge at:
Standard Disclaimer: It’s your money and your decision as to how to invest it.
I thank Worden Brothers for the charting system I use to post these charts. If you want to know more about the charting system I use every day, go to my “Other Resources” page here: Other Resources It makes it much easier to follow along with me if you can see the charts and manipulate them on your own computer. It’s a great investment to have an excellent charting system. Check it out with a free trial at the link above.
Copyright © 2017 By Wall Street Sun and Storm Report, LLC All rights reserved.

Happy New Year!
I stayed with “Passive Shorting” all of 2016. 17.8% gains at Year end. Now at 50% exposure. I’ll buy the pullbacks or just see how the New Administration and Congress deliver for the middle class via jobs.
Charles, you are a great example of how applying our system of passive shorting (selling exposure higher after buying lower) works. Great results!