A Market Timing Report based on the 1-13-2017 Close, published Monday January 16, 2016. Happy Martin Luther King Day!
I deliver focused comments on the markets. These are supplemented with “Tweets/StockTwits” (see links below).
1. SP500 Index: We’ll get to the U.S. market in a moment. I sold my Facebook position too early (after making about 7% in 4 market days on it), but have redistributed the profits in the Chinese internet ETF, KWEB. Here is the market timing chart:

Moving up within a triangle.
I shared that with you on Twitter and StockTwits on Friday.
There are some doubts about the vibrancy of the Chinese economy. The index (FXI) is still having some trouble making new highs. We will have big trouble in the U.S. economy if the Chinese do poorly as I’ve said. We are in this together. The growth of our companies depends on growth throughout the world, not just in the U.S, which is perceived as guaranteed by Trump’s domestic spending plans. Although I cut back my more generic Chinese exposure a bit, I’m now back up to an 88% China exposure level using the above ETF (that is as a percentage of “usual maximum exposure”; adjust it to your own taste/risk parameters). I believe Trump will have to work things out constructively with China.
The value of the internet in China is going to compound rapidly, and their companies are going to venture out into the world. I believe Alibaba CEO Jack Ma’s comments to President Elect Trump the other day that he planned on creating over 1 million jobs in the U.S. over the next 5 years tells you that “the Chinese are Coming!” And it will be via the internet not off a submarine as in the case of the 1966 movie, “The Russians Are Coming.” I believe this will force the resolution of the huge market timing triangle that you see in the KWEB chart above to be resolved to the upside.
If you do choose to invest in KWEB, please note that the number of shares traded daily is not tiny, but is somewhat limited, so refuse to pay too big of a spread between the net asset value and the trading price! Otherwise you are just handing money over to the market makers. Check the premium being paid HERE (or go to Morningstar and look up the symbol). As an ETF the fund will create more shares each day to accommodate interest, so the price will readjust toward the net asset value as demand increases and decreases. The risks obviously include Trump Twitter and press comments about high tariffs being applied to Chinese imports.
Trump’s news conference this week was troubling for the markets, and for market timing practitioners with their fingers on their trading buttons. I agree with them. He spent precious time answering completely false “fake news” charges. He claimed he would not have done what the “fake news” claimed, because “I’m a huge germophobe.” You don’t answer stupid claims like that. That’s exactly what the opposition wants. Once they create that picture in people’s heads, it’s stuck there despite claims to the contrary. It’s the “don’t think of an elephant” routine. The mind thinks in pictures.
Trump should have been answering key questions about the economy and tax reform etc. He didn’t.
He also attacked the drug industry out of the gate in his first few words, saying that the drug companies “are getting away with murder.” There are issues to be dealt with there, and it’s imperative that the pharmaceutical industry gets its act together and sits down with him and strikes a balance between the profits required to finance drugs at huge costs vs. the risks of those ventures failing.
We should all want our President to succeed at making our country better. I do want that, but the sort of inexperience and ineptness that we saw this week is not something the markets want to see in a leader of the largest economy in the world. If the trajectory of growth from tangible Trump policy changes becomes fuzzy, the markets will correct. That’s the biggest risk to this rally.
That said, the market still has the opportunity to have a market timing breakout to new highs. If it happens after an “Inaugural Pullback,” a further rally will still occur in my view. Have some cash handy in case there is some sort of “Sell the Trump Inauguration” move in the markets. I remain highly invested however and my exposure levels are given at the social media links below…
You can see exactly what I did this week at either of these two links:
Twitter® Follow Me on Twitter®. Follow Me on StockTwits®.
Keep up-to-date during the week at Twitter and StockTwits (links above), where a combined 23, 313 people are joining in… If you don’t follow me on Twitter already, you’ve been missing a lot…
SP500 Large Cap Index (click chart to enlarge; SPX, SPY):
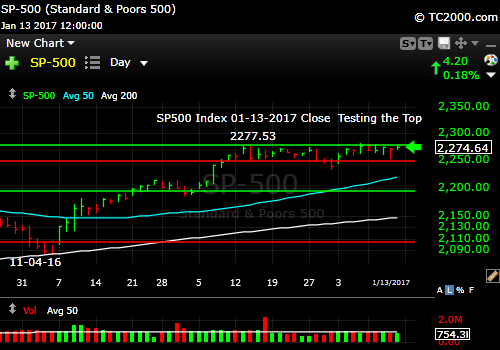
Testing back at the top.
Survey Says! Sentiment of individual investors (AAII.com) showed a Bull minus Bear percentage spread of +16.67% back down a bit from +21.0% last week.
Sentiment around this level leaves room in both directions in the short term, but the behavior of sentiment over longer time ranges says we have not yet reached a market top. Top’s are not met with mediocre sentiment.
| Thurs. 12 am close to poll | Bulls 43.64% | Neutrals 29.39% | Bears 26.97% |
2. U.S. Small Caps: Small caps are holding up in a fairly narrow range. The assumption is that the market needs to see economic progress under Trump’s administration to make progress or at least that’s the illusion. Watch the market for the direction of the next move rather than guessing what it will be. The lines are clear for both large and small caps.
Russell 2000 U.S. Small Cap Index (click chart to enlarge; RUT, IWM):
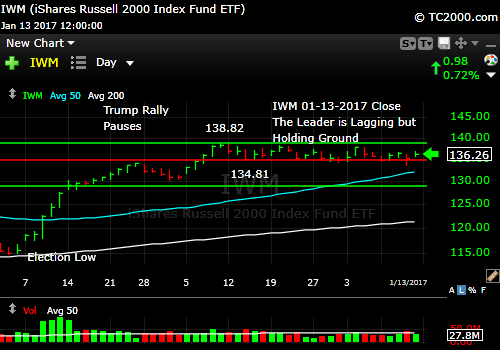
Holding up. Waiting for growth?
3. Gold: UPDATE 1-17-2017 Trump Weak Dollar Policy in Action
Gold is rallying as a result of a Trump comment to the Wall St. Journal late Monday, “Our companies can’t compete w them (China) now because our currency is too strong. And it’s killing us.” Everything for Trump is about killing/murder as w drug companies last week. He sensationalizes everything. But he makes his view heard, that is for sure. For this reason, the dollar is down in the current swing farther than I expected, so I’ve removed my small gold hedge. Beware of Trump “prey” over the next four years. When he takes his verbal gun out, feathers fly. Often unexpectedly.
If gold can close up here above the stated target range (see chart below), it could have another strong leg up before this rally is challenged.
Dropping the hedge may not work out. Perhaps the market will work through this currency jawboning by Trump, but I made a commitment when I opened the small hedge that I’d keep it on a short market timing leash, so I’ve closed it. Trump’s willingness to blurt out policy is something that is just part of investing in the Trump era. Welcome to the “‘New Bizarre’ of American Economic Leadership.”
It’s particularly bizarre given the fact that Larry Kudlow, one of Trump’s advisers is known for his “King Dollar” stance. The strong dollar is part of rising rates and a stronger economy. It’s not what Trump thinks. A strong currency is great IF there is economic growth to go with it. Message to Larry: Talk to Trump about ‘King Dollar.”
Gold faces the enemy of higher growth with higher rates. Pulling on the other side is inflation. If inflation rises faster than rates, gold will do well. A close over the range shown in the chart below is what I consider the “real test.” Gold just failed it, but if there is an “Inaugural Dip,” gold could push through to new recent highs. Follow the market rather than follow the rhetoric. I suggested taking OFF some gold exposure near the high last week. I hedged part of my long term position, as I felt the dollar was ready to rebound from its recent pullback.
The argument FOR gold is down to one: Inflation will rise faster than the Fed will raise rates. That is definitely NOT a given.
The return on gold has become far more speculative with both rising rates and a rising US dollar. Those are huge headwinds as I’ve explained HERE.
Gold ETF (click chart to enlarge the chart; GLD):

Gold failed an important breakout.
4. U.S. 10 Year Treasury Note Yield (TNX): The market timing “re-breakout” of the 10 Year Treasury yield above 2.621% has not happened…not yet.
I am currently in the camp that says that if the Federal Reserve continues to raise rates this year, long rates will actually fall rather than rise. That would means bonds would still do OK this year. That said, I expect stocks to outperform bonds over the intermediate term (3 months to a year). The risk? If the Trump stimulus is quick and massive, inflation could accelerate substantially and wreck bonds.
You can see where the line has been drawn demarcated by the 2.489% level and the green down trend line in the chart below…
U.S. 10 Year Treasury Note Yield (click chart to enlarge; TNX,TYX,TLT,TBF):

Rates backed off of resistance.o
Now please go ahead and leave your comments below where it says “Leave a Reply”… just scroll down and comment…
Note that ALTHOUGH my newsletter is now CLOSED to new subscriptions: You can Join the Wait List to Receive the Newsletter as a Loyal Subscriber, Opening again for the April 2nd issue. Note that if you join and don’t read the newsletter, you will be deleted. Why? I don’t publish to non-readers as other newsletters do. I surround myself with committed people who value what we are doing. Stay tuned here in the meantime and follow all the action via the Twitter® and StockTwits® links above.
Be sure to visit the website for more general investing knowledge at:
Standard Disclaimer: It’s your money and your decision as to how to invest it.
I thank Worden Brothers for the charting system I use to post these charts. If you want to know more about the charting system I use every day, go to my “Other Resources” page here: Other Resources It makes it much easier to follow along with me if you can see the charts and manipulate them on your own computer. It’s a great investment to have an excellent charting system. Check it out with a free trial at the link above.
Copyright © 2017 By Wall Street Sun and Storm Report, LLC All rights reserved.
