A Market Timing Report based on the 1-20-2017 Close, published Sunday January 22, 2016.
I deliver focused comments on the markets. These are supplemented with “Tweets/StockTwits” (see links below).
UPDATE 1-26-2017: “Gold pivot point confirmed. Going down”…
I pointed out in my market timing blog post of 1-06-2017 GLD was going to test a key target range of 115.00-115.20 and this would be a pivot point. When the price is increasing, pivot points are where the Bulls have to show strength and continue the rally. When they don’t, the pivot becomes a trading sell point with a downward pivot. That’s what I suggested was happening and now we have three days of declines.
There is one catch, given the nuances of the current market timing chart. GLD could pull back to test the 50 day moving average and then rally again. Could. It’s just one spot where a counter-rally could occur. In the meantime, you should have preserved your trading gold profits. If we get another rally that takes us above 115.20, it’s very possible it would stick. It would be a place to add exposure, OR we wait for a rebound off of significantly lower prices.

Market timing failure at key target.
Back to this week’s market timing post…
1. SP500 Index: President Trump was inaugurated Friday and just before his speech, the markets rallied, then retested the close from the prior day and, finally, rose into the close to recoup just over half the initial gains.
Here is what happened on a market timing basis:

1 Minute SP500 Index Market Timing Chart of Inauguration Day.
The market is at a decision point. It must decide whether further proof of Trump’s policies and their associated economic successes will be required or not, before there is a further significant rally. Interestingly only 2 of 21 Trump cabinet appointees have been appointed by the Senate, which is well behind the Obama confirmation schedule in 2009. If the Democrats are unwilling to cooperate out of a vindictive spirit (to get back at the Republicans for opposing all that they wanted done after President Obama’s first 2 years), things could go much slower for Trump in instituting his policies. That could disappoint the markets. We have “powder left” should the markets pull back and plenty of long exposure should they break out again.
I believe that gold and the 10 Year Treasury Yield could be a strong market timing “tell” on what the stock market will do next. If you see rates breaking out above resistance (noted below; see chart) or gold rising easily past the current target range it very NON-coincidently landed in, stocks will likely suffer further losses. On the other hand if those two head lower, stocks will likely break out to new market timing highs. The ultimate market timing impact of the Fed raising interest rates over the next couple of years as they threaten to do will be to drive down long term rates UNLESS Trump policies spark major inflation.
That prediction aside, we can follow the move out of the current consolidation range. The next move should be several percent and tradable if you are interested.
We’ll be buying lower on any Trump Dip if it occurs and ready to take some profits if the next move is through the top of this consolidation.
You can see exactly what I did this week at either of these two links:
Twitter® Follow Me on Twitter®. Follow Me on StockTwits®.
Keep up-to-date during the week at Twitter and StockTwits (links above), where a combined 23, 505 people are joining in… If you don’t follow me on Twitter already, you’ve been missing a lot…
SP500 Large Cap Index (click chart to enlarge; SPX, SPY):
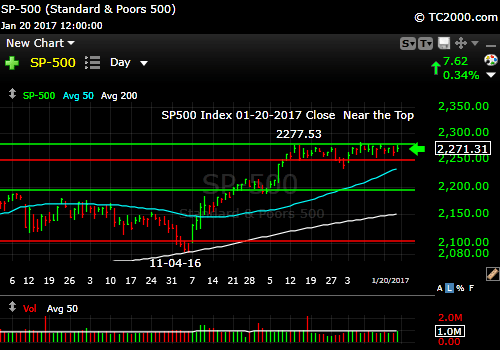
Stocks next move will depend on “politics.”
Survey Says! Sentiment of individual investors (AAII.com) showed a Bull minus Bear percentage spread of +4.33% down from +16.67% last week.
This has happened despite the fact that the market remains near all time highs. This is Bullish, not Bearish over the intermediate term. The short term market timing set-up could be another story altogether.
| Thurs. 12 am close to poll | Bulls 37.01% | Neutrals 30.32% | Bears 32.68% |
2. U.S. Small Caps: Small caps are testing the bottom of their recent range. A break here would cause a bit of damage. Follow small caps along with gold and the 10 Year Yield on Monday. A breach by small caps could give way to a bigger “Trump Dip.”
Russell 2000 U.S. Small Cap Index (click chart to enlarge; RUT, IWM):

Small caps testing support.
3. Gold: First see my UPDATE from 1-17-2017 – Trump Weak Dollar Policy in Action (Scroll Down to Gold Update)
We are right in the middle of the market timing target range I picked out on 1-06-2017. From here we pivot up or down. Traders and even investors should consider following this bouncing ball. Add with a stop in mind in case the market rises and then reverses lower, or exit more of your profitable gold positions if the market fails here. The move from here could be sizable, up or down.
Gold ETF (click chart to enlarge the chart; GLD):

Gold has a decision to make. This is a pivot point.
4. U.S. 10 Year Treasury Note Yield (TNX): The yield remains in a test of key levels. You can see where the line has been drawn demarcated by the 2.489% level and the down trend line in the chart below… The second yellow line from the top, that 2.489% level, will be the next test. Others say the key yield breakouts are a bit higher. You can read my Twitter feed for those numbers. Keep in touch on social media during the week… (links above)
U.S. 10 Year Treasury Note Yield (click chart to enlarge; TNX,TYX,TLT,TBF):

Above the trend line but below resistance.
Now please go ahead and leave your comments below where it says “Leave a Reply”… just scroll down and comment…
Note that ALTHOUGH my newsletter is now CLOSED to new subscriptions: You can Join the Wait List to Receive the Newsletter as a Loyal Subscriber, Opening again for the April 2nd issue. Note that if you join and don’t read the newsletter, you will be deleted. Why? I don’t publish to non-readers as other newsletters do. I surround myself with committed people who value what we are doing. Stay tuned here in the meantime and follow all the action via the Twitter® and StockTwits® links above.
Be sure to visit the website for more general investing knowledge at:
Standard Disclaimer: It’s your money and your decision as to how to invest it.
I thank Worden Brothers for the charting system I use to post these charts. If you want to know more about the charting system I use every day, go to my “Other Resources” page here: Other Resources It makes it much easier to follow along with me if you can see the charts and manipulate them on your own computer. It’s a great investment to have an excellent charting system. Check it out with a free trial at the link above.
Copyright © 2017 By Wall Street Sun and Storm Report, LLC All rights reserved.

10-year treasury seems like a key indicator! Will follow closely.