
A Market Timing Report based on the 1-27-2017 Close, published Sunday January 29, 2017.
I deliver focused comments on market timing once or twice a week. These are supplemented with daily “Tweets/StockTwits” (see links below).
UPDATE 1-31-2017 on Interest Rates, the US Dollar and Gold:
GLD is up 1.44% today because the dollar is down 0.81% (UUP) and the interest rates on the the 10 Year Treasury Note is down to 2.437%. This happened due to remarks by Peter Navarro, Trump’s trade advisor, to the Germans that they were taking advantage of the Euro’s low valuation to dump their goods in the US. Those were the comments and these are the market timing signals that matter – rates fell, the dollar fell and gold rose. It must continue down and violate the green trend line shown below to send gold to new heights:
Will the Fed hold off as expected on Weds. and NOT raise rates again until June or July at the earliest?
Remember that the market does NOT expect the Federal Reserve to raise rates again on Wednesday. I don’t either based on the odds, but IF they do, gold will head down again and the dollar will soar…
Now please review this week’s market timing signals so you are prepared for the week….
1. SP500 Index: The Trump Rally is continuing for the SP500 Index, but it has not continued for the small caps as you’ll see below. I believe the market is waiting for further confirmation of Trump’s promises. GDP was OK but not surprisingly great for the 4th Quarter of 2016, coming in at 1.9% vs. 2.2% consensus and 3.5% prior. Remember the headline number I am quoting is a seasonally adjusted annualized rate. This means that growth weakened into the 4th quarter, and we’ll have to watch its trajectory. Business activity should strengthen after the lull of the Presidential Election period.
If you are market timing the next move, watch the small caps, and if they confirm the large cap strength with a new breakout, we may well see another sizable leg up in the U.S. stock market. If you invest simply based upon valuations, you’ll miss many big market moves. Given the strong domestic equity fund outflows we’ve seen, there is plenty of room for buyers to come back into this market.
Also watch the Fed, with their decision on rates out on Weds. Feb. 1st after a two day meeting (no “Fed show” afterwards). The Federal Reserve is not expected to hike rates further until June or July. That is when the CME says the odds of a hike approach 50% (June) and then exceed it (July).
Keep up-to-date during the week at Twitter and StockTwits (links below), where a combined 23, 726 people are joining in…
Twitter® Follow Me on Twitter®. Follow Me on StockTwits®.
You don’t have to Tweet to read my Tweets… Just click above and sign up…
SP500 Large Cap Index (click chart to enlarge; SPX, SPY):

Breakout is still intact.
Survey Says! Sentiment of individual investors (AAII.com) showed a Bull minus Bear percentage spread of -1.91% down a bit from +4.33% last week.
| Thurs. 12 am close to poll | Bulls 31.58% | Neutrals 34.93% | Bears 33.49% |
This sentiment weakness is not dramatic and is poorly predictive of future results. All it says is that there is plenty of room for recruitment of new Bulls from the Neutral and Bear camps.
2. U.S. Small Caps: Last week I said: “I would not add to positions without either:
- Another small cap breakout.
- A pullback worth buying percentage-wise.”
The same market timing signals apply for this week. Stay away without a greater discount or a new breakout.
Russell 2000 U.S. Small Cap Index (click chart to enlarge; RUT, IWM):

Stuck in range and NOT confirming the SP500 Index breakout yet.
3. Gold: Gold failed the key breakout range of 115.00-115.20 and this must be reversed on a market timing basis quickly or the Bears will extract far more blood. The Bulls actually have a shot at bouncing from this support level, which nearly coincides with the 50 day moving average. The fact that rates are falling again this week says this is not an impossibility. Lower rates are good for gold.
Gold ETF (click chart to enlarge the chart; GLD):
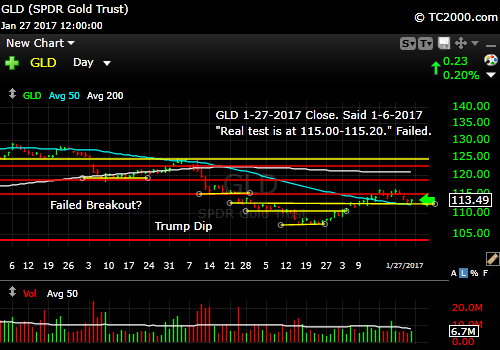
Gold failed a key breakout area, so Bulls need to reverse this quickly.
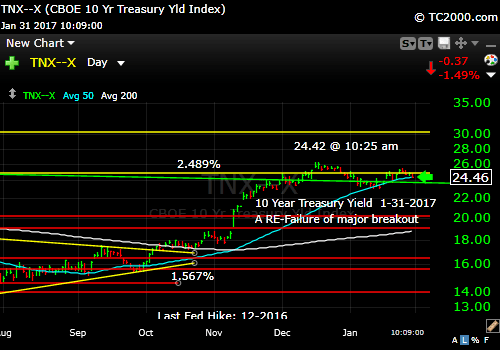
4. U.S. 10 Year Treasury Note Yield (TNX): We’re back below the 2.489% market timing resistance level. As said last week, the reversal in Treasuries should be watched for a RE-breakout to new highs above the recent high of 2.621%.
Market timing practitioners should follow these key numbers and trade in the direction of the next move, which remains to be seen. A double failure of a breakout could be seen as decisive, but I’d like to see follow through on it. Furthermore, that green trend line must be quickly violated to the downside by the Bond Bulls.
U.S. 10 Year Treasury Note Yield (click chart to enlarge; TNX,TYX,TLT,TBF):

Failure of interest rate breakout a second time.
Now please leave your comments below where it says “Leave a Reply”… just scroll down and comment…
Note that ALTHOUGH my newsletter is now CLOSED to new subscriptions: You can Join the Wait List to Receive the Newsletter as a Loyal Subscriber, Opening again for the April 2nd issue. Note that if you join and don’t read the newsletter, you will be deleted. Why? I don’t publish to non-readers as other newsletters do. I surround myself with committed people who value what we are doing. Stay tuned here in the meantime and follow all the action via the Twitter® and StockTwits® links above.
Be sure to visit the website for more general investing knowledge at:
Standard Disclaimer: It’s your money and your decision as to how to invest it.
I thank Worden Brothers for the charting system I use to post these charts. If you want to know more about the charting system I use every day, go to my “Other Resources” page here: Other Resources It makes it much easier to follow along with me if you can see the charts and manipulate them on your own computer. It’s a great investment to have an excellent charting system. Check it out with a free trial at the link above.
Copyright © 2017 By Wall Street Sun and Storm Report, LLC All rights reserved.
