A Market Timing Report based on the 2-10-2017 Close, published Sunday February 12, 2017
I deliver focused comments on market timing once or twice a week. These are supplemented with daily “Tweets/StockTwits” (see links below).
1. SP500 Index: On 1-30-2017, the SP500 Index was back-testing the prior high. Now it’s up and over the 1-26-2017 high to a brand new all time high, but as I’ll get to, without the small caps. Trump had a bad week with revelations about Michael Flynn who lied to the administration about his conversations with the Russians and a ruling in an appeals court blocking his immigration ban short of a Supreme Court reversal, which may be abandoned by him. These sorts of missteps create greater uncertainty in the markets, who seek steady Presidential leadership.
We have as of yet only PART of one out of three market timing signals necessary for the next leg of the stock market to be sustainable. Review my comments: HERE
As you’ll see below, the gold and rate signals are OFF. We are also waiting for the small caps (IWM) to confirm the large cap (SPY, SPX) breakout to new highs.
The market may be perturbed by comments before Congress of Dr. Yellen, Chair of the Federal Reserve, scheduled for 10 am on Tues. and Weds. If she sounds too hawkish, or even too dovish at this point, the markets won’t like it. The economy should continue to strengthen or else interest rate hikes won’t be warranted. Dr. Y. has to come in “not too hot or cold.” Pay attention to her scripted and unscripted comments during these sessions.
Keep up-to-date during the week at Twitter and StockTwits (links below), where a combined 23, 990 people are joining in…
Twitter® Follow Me on Twitter®. Follow Me on StockTwits®.
You don’t have to Tweet to read my Tweets… Just click above and sign up…
Take a look at the chart now, which shows the latest retest and breakout for large caps…
SP500 Large Cap Index (click chart to enlarge; SPX, SPY):
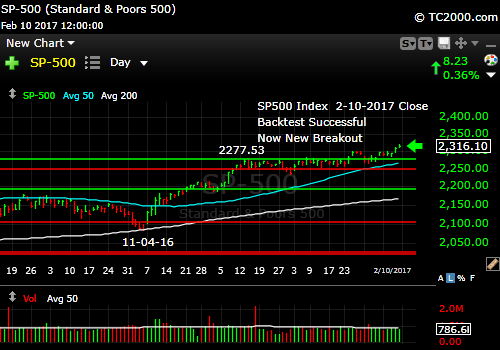
Up and over. Backtest was successful and now a new breakout high.
Survey Says! Sentiment of individual investors (AAII.com) showed a Bull minus Bear percentage spread of +8.15% up from -1.37% last week.
| Thurs. 12 am close to poll | Bulls 35.80% | Neutrals 36.74% | Bears 27.65% |
There is still no top in sight per this sentiment reading (a spread of 20-30 or more can mark a top). Interestingly the financial advisors are at high levels of Bullishness per recent Investor’s Intelligence numbers, so individual investors are not yet convinced! See my Twitter feed for those numbers (link above). That means there is room to expand the Bull camp.
2. U.S. Small Caps: Nope. No confirmatory market timing signal yet for small stocks, as small caps, which were the leaders, are now lagging the SP500 Index on a market timing basis. That is a negative. The strongest market rallies are broad based, not narrow.
Russell 2000 U.S. Small Cap Index (click chart to enlarge; IWM, RUT):
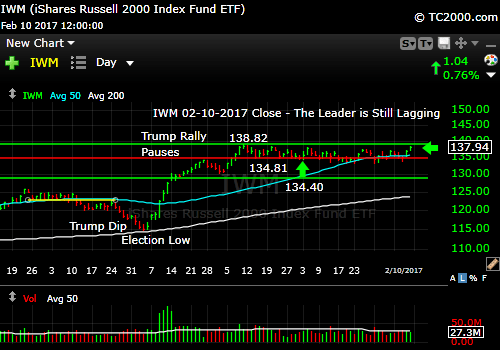
No “Go” for the overall market with small caps still lagging.
3. Gold: The “gold market timing signal” for the stock market rally is OFF, because gold is not breaking down as it should, given a robust economy with inflation under control. Perhaps the market believes Trump growth will come at the cost of increased levels of inflation that run ahead of Fed policy moves. Gold investors apparently think so! The only other camp who would be routing for gold would be those who think 1) Trump policies won’t help growth much and 2) The Fed will have to keep rates low or even drop them back to zero.
Remember that it is possible for the stock market to rise through a period of higher inflation and make the REAL inflation-adjusted return turn NEGATIVE as happened in the 1970s. Back then, many investors thought they were making money, but they were actually losing it! Gold was the place to be back then until President Ronald Reagan and Fed Chair Paul Volcker stepped in to change the economic picture away from the stagnation and major inflation under President Jimmy Carter.
Now to the gold market timing chart…Note in the chart, how gold back-tested the prior high and bounced. It should make another step up this week if this is a real Bull trend. Dr. Yellen’s comments could obviously impact metals this week, and flip the gold trade upside down.
Gold ETF (click chart to enlarge the chart; GLD):

Gold signal is OFF for stock rally, meaning gold is still being favored.
4. U.S. 10 Year Treasury Note Yield (TNX): We’re now back below the 2.489% market timing resistance level I noted weeks ago. This means, just as with gold, that growth and inflation is not seen as likely by the markets. This week at least! Not until all three signals fire off (see above) will stocks be in the clear for another market timing leg up.
Here’s the 10 Year Yield chart, showing how the “yellow line” is being held…
U.S. 10 Year Treasury Note Yield (click chart to enlarge; TNX, IEF, TYX,TLT,TBF):

Rates still below target.
Now please leave your comments below where it says “Leave a Reply”… just scroll down and comment or ask a question…
Note that ALTHOUGH my newsletter is now CLOSED to new subscriptions: You can Join the Wait List to Receive the Newsletter as a Loyal Subscriber, Opening again for the April 2nd issue. Note that if you join and don’t read the newsletter, you will be deleted. Why? I don’t publish to non-readers as other newsletters do. I surround myself with committed people who value what we are doing. Stay tuned here in the meantime and follow all the action via the Twitter® and StockTwits® links above.
Be sure to visit the website for more general investing knowledge at:
Standard Disclaimer: It’s your money and your decision as to how to invest it.
I thank Worden Brothers for the charting system I use to post these charts. If you want to know more about the charting system I use every day, go to my “Other Resources” page here: Other Resources It makes it much easier to follow along with me if you can see the charts and manipulate them on your own computer. It’s a great investment to have an excellent charting system. Check it out with a free trial at the link above.
Copyright © 2017 By Wall Street Sun and Storm Report, LLC All rights reserved.
