
A Market Timing Report based on the 2-17-2017 Close, published Sunday February 19, 2017
I deliver focused comments on market timing once or twice a week. These are supplemented with daily “Tweets/StockTwits” (see links below).
1. SP500 Index: What’s the market timing “signal count” you may ask? We still lack 2 of 3 signals for the next leg of the stock market to be sustainable. Review my comments: HERE As you’ll see, the gold and rate signals are OFF, which means they are rallying. On the other hand, small caps are now verifying the new highs in the large caps although just barely as noted in the IWM chart below.
The Federal Reserve Chair Yellen’s remarks before Congress this week indicated an increased concern for inflation and a willingness to hike, given supportive data. Despite that, the CME Group data showed little change with just 17.7% expecting a move in March. That is what is called “not being priced in” by the market. Either the Fed is bluffing or the market will be caught by the next rate hike arriving much sooner than expected.
There is a potential for a “black swan” European event, one that is becoming more obvious at this point, namely the election of Le Pen in France with an accompanying #Frexit from the European Union. That would potentially end the EU, or at least its long term viability. Read about it HERE.
A Frexit from the EU could present our next market timing buying opportunity as we saw after #Brexit, when investors understood that Brexit actually helps the U.S. rather than hurts it, because it can make competitive agreements with each European trade partner rather than being subject to the EU negotiating as a cohesive unit. Note that a Frexit would cause a big drop in European stocks in Euro terms. The Euro would likely crash below 0.95 US dollars.
The good news is that the U.S. market has room to move still higher. Valuation alone does not stop markets as we learned back in 1998-99, but may suggest one should not be over-leveraged in stocks at this point. The long sideways move of the Sp500 Index in December and January allows for a further upswing here.
Keep up-to-date during the week at Twitter and StockTwits (links below), where a combined 24,533 people are joining in…
Twitter® Follow Me on Twitter®. Follow Me on StockTwits®.
You don’t have to Tweet to read my Tweets… Just click above and sign up…
Take a look at the chart now and you’ll see the current consolidation setting up for the next move…
SP500 Large Cap Index (click chart to enlarge; SPX, SPY):

Consolidating, but at a higher high.
Survey Says! Sentiment of individual investors (AAII.com) showed a Bull minus Bear percentage spread of +0.73, down from +8.15% last week.
| Thurs. 12 am close to poll | Bulls 33.09% | Neutrals 34.55% | Bears 32.36% |
Amazingly, there is still no top in sight! Investors are getting more BEARISH as the market rises. That is the typical “climbing the wall of worry” scenario. Investors are definitely not buying the enthusiasm of newsletter writers who are extremely Bullish per Investors Intelligence reporting. They are yelling “Buy, Buy, Buy!” and yet their readers have been exiting equities and are fearful at all time highs. We will stay with the trend.
The market, if it corrects, will not correct badly in the absence of economic recession or an event that comes from left field, like a tsunami that washes away Washington, D.C.! A “Frexit,” as mentioned, is more apt to cause a temporary dip or at worst a correction in the U.S. Bull market. It would cause a temporary collapse in French shares in Euro terms, but would rally in U.S. dollar terms as happened with the FTSE after Brexit. The pound was pounded, but the FTSE was strong after a brief swoon.
2. U.S. Small Caps: We finally have the small cap confirmation I was looking for. The stock signal is ON. We need the rate signal to turn on for this rally to sustain itself.
Russell 2000 U.S. Small Cap Index (click chart to enlarge; IWM, RUT):

Small caps confirm.
3. Gold: The “gold market timing signal” for the stock market rally is OFF. IF the rate signal stays in the OFF position, that favors gold holding value and rallying as rates fall, but it would not bode well for the stock market rally if both of these occur.
The U.S. stock market rally will lose steam after a while if growth is not actually in the cards. Remember that growth with mild inflation and a vigilant Fed means gold LOSES as explained in my article on “When Does Gold Shine…”
Could gold surprise us and RISE in a continued stock market rally? Yes, it’s possible in a growth with inflation scenario with the Fed falling behind enough to allow longer term rates to rise. A proactive Fed could kill stock market momentum by slowing growth and actually lower long rates and flatten the yield curve. You see how important the Fed is in this equation?
Perhaps Trump induced inflation drives both gold and the stock market higher in the U.S., but rates would have to be rising for that. This scenario played out in mid-2003 with TNX at 3.35% then rising to 5.14% in mid-2006 and re-peaking in mid-2007 as the stock market was peaking – and then we had the “Great Recession” market decline (although gold was much cheaper back then). Remember that the Fed cannot, due to its mandate, allow for “rising inflation with falling Fed rates.” It is sworn to fight inflation particularly when unemployment is at current levels.
Gold ETF (click chart to enlarge the chart; GLD):
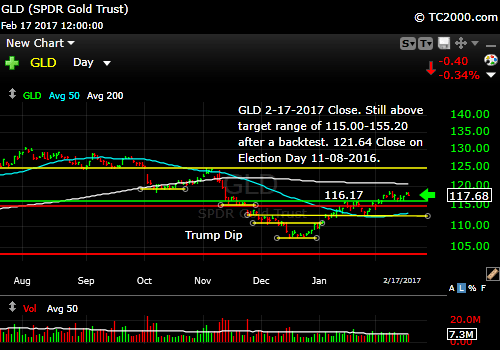
Gold rally still intact.
4. U.S. 10 Year Treasury Note Yield (TNX): We’re still below the 2.489% market timing resistance level I noted weeks ago. This does NOT confirm the stock market signal. It suggests that growth may be slower than the market is currently thinking or that the Fed is going to tighten too much, too quickly.
Oddly enough, the stock market breakouts do NOT suggest that, so this must resolve one way or another. Rising rates and rising stocks or falling rates with falling stocks. What suspense!
The yellow resistance line now lines up with the top of a triangle. The trade is in the direction of resolution of this triangle. If rates break further to the downside (below the triangle and then continue below the 2.309% low for further market timing confirmation), the U.S. stock market rally will stall and could correct.
U.S. 10 Year Treasury Note Yield (click chart to enlarge; TNX, IEF, TYX,TLT,TBF):
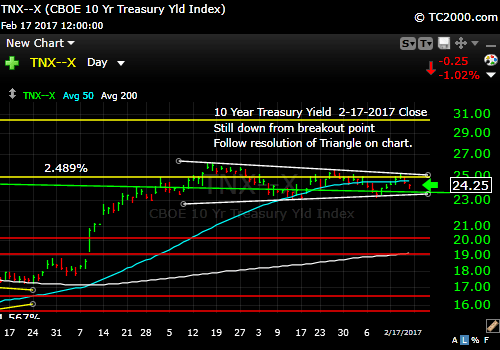
Yields back down despite Trump’s growth plans.
Now please leave your comments below where it says “Leave a Reply”… just scroll down and comment or ask a question…
Note that ALTHOUGH my newsletter is now CLOSED to new subscriptions: You can Join the Wait List to Receive the Newsletter as a Loyal Subscriber, Opening again for the April 2nd issue. Note that if you join and don’t read the newsletter, you will be deleted. Why? I don’t publish to non-readers as other newsletters do. I surround myself with committed people who value what we are doing. Stay tuned here in the meantime and follow all the action via the Twitter® and StockTwits® links above.
Be sure to visit the website for more general investing knowledge at:
Standard Disclaimer: It’s your money and your decision as to how to invest it.
I thank Worden Brothers for the charting system I use to post these charts. If you want to know more about the charting system I use every day, go to my “Other Resources” page here: Other Resources It makes it much easier to follow along with me if you can see the charts and manipulate them on your own computer. It’s a great investment to have an excellent charting system. Check it out with a free trial at the link above.
Copyright © 2017 By Wall Street Sun and Storm Report, LLC All rights reserved.
