
A Market Timing Report based on the 3-03-2017 Close, published Sunday March 5, 2017
I deliver focused comments on market timing once or twice a week. These are supplemented with daily “Tweets/StockTwits” (see links below).
1. SP500 Index: Federal Reserve speakers have repeatedly said it’s time to raise rates, so a March hike is a lock in my view and the CME says it’s a 79.7% probability. This is OK because both ISM manufacturing and services were strong this week. This says further economic growth under Trump is very possible. It’s happening in fact. Rates can climb along with the stock market as long as growth is accelerating.
My sense is this will resolve to the upside, rather than in a correction. For that reason I added more midcap exposure on Friday (IJH). IJH has outperformed IWM small caps since the 2009 low and the SP500 Index by much more. (see social media links for more)
SP500 Large Cap Index (click chart to enlarge; SPX, SPY):
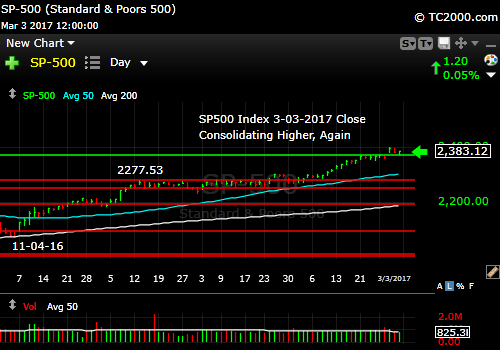
Edging up despite small cap lag.
Survey Says! Sentiment of individual investors (AAII.com) showed a Bull minus Bear percentage spread of +2.29% down a bit from +6.15% last week.
| Thurs. 12 am close to poll | Bulls 37.91% | Neutrals 26.47% | Bears 35.62% |
Still holds from last couple of weeks: “There’s still not enough Bullishness among individual investors to call this a top.”
Keep up-to-date during the week at Twitter and StockTwits (links below), where a combined 24,533 people are joining in…
Twitter® Follow Me on Twitter®. Follow Me on StockTwits®.
2. U.S. Small Caps: Back below target this week, but barely (top green line in market timing chart below). The market will only have another leg up if and when it believes Trump policies are going to incite stronger growth. Otherwise we may see a dip or correction soon. Pay attention to this signal as well as gold and rates below. Review the “Three Signals” that will mean another big stock market up leg: HERE
Russell 2000 U.S. Small Cap Index (click chart to enlarge; IWM, RUT):

Small caps slip again below target.
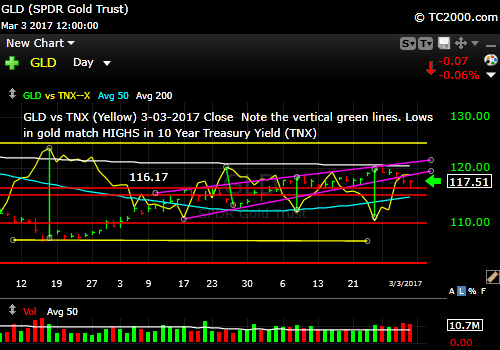
3. Gold: Rates bounced and gold fell. That equation rules the gold market right now. Look at the second market timing chart to see how interest rates are negatively correlated with the price of gold. (The green lines highlight the peaks and valleys in yields and the corresponding gold lows and highs, respectively.)
Gold ETF (click chart to enlarge the chart; GLD):
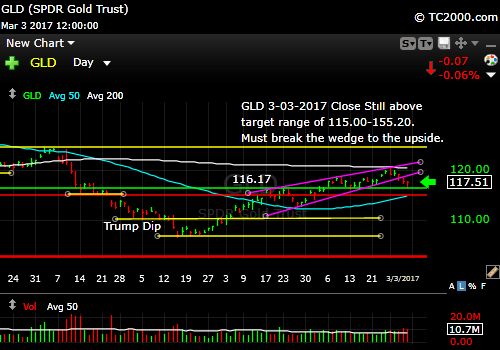
Gold eases as rates rise.
Rates down, gold UP. Rates up, gold DOWN.
4. U.S. 10 Year Treasury Note Yield (TNX): We’re now just barely above the 2.489% market timing resistance level I noted weeks ago. I said two weeks ago, “The trade is in the direction of resolution of this [white] triangle.” Follow that this week! A break of rates above that upper white line means Trump’s growth with inflation game is ON, and the stock market will likely be rallying.
U.S. 10 Year Treasury Note Yield (click chart to enlarge; TNX, IEF, TYX,TLT,TBF):

Rates just over target.
Now please leave your comments below where it says “Leave a Reply”… just scroll down and comment or ask a question…
Note that ALTHOUGH my newsletter is now CLOSED to new subscriptions: You can Join the Wait List to Receive the Newsletter as a Loyal Subscriber, Opening again for the April 2nd issue. Note that if you join and don’t read the newsletter, you will be deleted. Why? I don’t publish to non-readers as other newsletters do. I surround myself with committed people who value what we are doing. Stay tuned here in the meantime and follow all the action via the Twitter® and StockTwits® links above.
Be sure to visit the website for more general investing knowledge at:
Standard Disclaimer: It’s your money and your decision as to how to invest it.
I thank Worden Brothers for the charting system I use to post these charts. If you want to know more about the charting system I use every day, go to my “Other Resources” page here: Other Resources It makes it much easier to follow along with me if you can see the charts and manipulate them on your own computer. It’s a great investment to have an excellent charting system. Check it out with a free trial at the link above.
Copyright © 2017 By Wall Street Sun and Storm Report, LLC All rights reserved.
