A Market Timing Report based on the 2-24-2017 Close, published Sunday February 26, 2017
I deliver focused comments on market timing once or twice a week. These are supplemented with daily “Tweets/StockTwits” (see links below).
1. SP500 Index: Are you market timing the Fed? The Federal Reserve Minutes were released on Wednesday and indicated a Fed that wants to hike, given the inflationary pressure they see, but the bond market pretty much laughed in their faces and Treasury yields fell. Of course, they fell abroad too. Review my comments about the three signals we are following: HERE. All three signals are now off again, although the stock signal may switch back if it does so in the next few days. The PMI numbers on manufacturing and services are the only data out this week of note.
The U.S. GDP number due out Tuesday is a second revision of Q4 GDP, which should be higher than the prior estimate per Bloomberg News (2.0-3.1% vs. 1.9% prior (1st estimate). If it is pushing the high end of that consensus range, rates would rise again. Stocks would also likely rally. Growth is what the market is yearning for in the numbers.
SP500 Large Cap Index (click chart to enlarge; SPX, SPY):
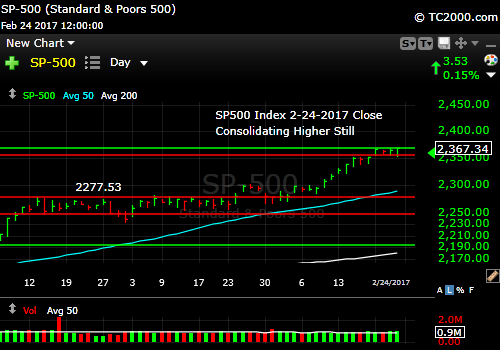
SP500 Index moves up to another higher level of consolidation.
Survey Says! Sentiment of individual investors (AAII.com) showed a Bull minus Bear percentage spread of +6.15%, up from +0.73% last week.
| Thurs. 12 am close to poll | Bulls 38.46% | Neutrals 29.23% | Bears 32.31% |
There’s still not enough Bullishness among individual investors to call this a top. The one negative of this could be that IF we do have a dip from these levels due to some economic number or outside factor, investors may feel their fears were warranted, and the pullback could be a bit deeper than it otherwise would be. The Bull would likely then resume until euphoria sets in and people who are not invested in stocks are being called “dumb.” Then we will sell some or tighten our stops.
Keep up-to-date during the week at Twitter and StockTwits (links below), where a combined 24,533 people are joining in…
Twitter® Follow Me on Twitter®. Follow Me on StockTwits®.
2. U.S. Small Caps: We finally had the small cap market timing confirmation with the breakout to new highs I was looking for, and suddenly we have a failure or at least a retest in this last pullback. The stock market signal for a continued strong, broad based rally is now OFF despite what the SP500 Index may do. Its days will be numbered too if this week small caps cannot reverse their breakout failure.
Russell 2000 U.S. Small Cap Index (click chart to enlarge; IWM, RUT):

Small caps led the Trump Rally up and then stalled. After breaking out to new highs they “gave it up,” which is a negative.
3. Gold: You could guess that the rise in gold signals inflationary fears, but rates are moving in the wrong direction for that. Instead gold is still being used as a hedge against falling interest rates or at least negative or at least very low real rates. Gold should be falling in the scenario known around here as “TrumpFlation,” growth with inflation. Spending fiscal dollars has a cost known as inflation. If we get little growth from the spending, we could have stagflation instead. Not at all what the stock market was expecting when it rallied.
The Bear wedge shown below in magenta needs watching as a market timing signal. It MUST be cut through to the upside for the gold rally to continue. The one promising sign was the rise in volume with the last bump up on Friday.
Gold ETF (click chart to enlarge the chart; GLD):

GLD must break through the top edge of the upward wedge.
4. U.S. 10 Year Treasury Note Yield (TNX): We’re now even further below the 2.489% market timing resistance level I noted many weeks ago. I said last week, “The trade is in the direction of resolution of this [white] triangle.” If that breaks to the downside, “TrumpFlation” is off. Below there, the market would be saying it expects slow growth at best and no significant inflation requiring Fed hikes. 2.309% is the magic support number at that magenta line in the chart below. Follow it with me next week. See you on Twitter/StockTwits this week!
U.S. 10 Year Treasury Note Yield (click chart to enlarge; TNX, IEF, TYX,TLT,TBF):
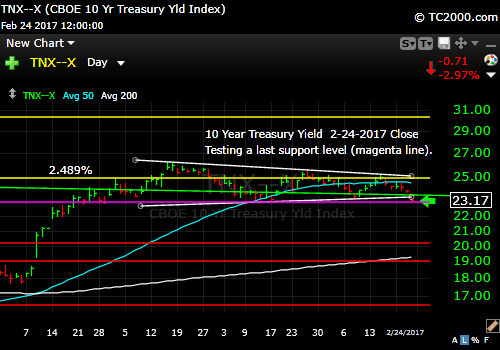
10 Year Yield falling again and on last support (magenta line).
Now please leave your comments below where it says “Leave a Reply”… just scroll down and comment or ask a question…
Note that ALTHOUGH my newsletter is now CLOSED to new subscriptions: You can Join the Wait List to Receive the Newsletter as a Loyal Subscriber, Opening again for the April 2nd issue. Note that if you join and don’t read the newsletter, you will be deleted. Why? I don’t publish to non-readers as other newsletters do. I surround myself with committed people who value what we are doing. Stay tuned here in the meantime and follow all the action via the Twitter® and StockTwits® links above.
Be sure to visit the website for more general investing knowledge at:
Standard Disclaimer: It’s your money and your decision as to how to invest it.
I thank Worden Brothers for the charting system I use to post these charts. If you want to know more about the charting system I use every day, go to my “Other Resources” page here: Other Resources It makes it much easier to follow along with me if you can see the charts and manipulate them on your own computer. It’s a great investment to have an excellent charting system. Check it out with a free trial at the link above.
Copyright © 2017 By Wall Street Sun and Storm Report, LLC All rights reserved.
