
A Market Timing Report based on the 4-03-2017 Open, published Monday April 3, 2017
I deliver focused comments on market timing once or twice a week. These are supplemented with daily “Tweets/StockTwits” (see links below).
1. SP500 Index: The market wants to know:
1) Trump can lead. This means he must get Judge Gorsuch appointed to the Supreme Court. He’s already lost on his travel ban and the Obamacare replacement bill known as AHCA.
2) The market will continue to bounce to lower market timing highs and languish in a range until it is convinced that “Trump means MORE business” for the U.S. The market is not broken yet, just tentative about whether Trump will come through on his promises. I remain long (you can see my exposure level posted on social media – links below).

Bouncing toward retest, but could fall short.
Continue to follow my 3 signals defined in early February HERE.
As of today: STOCK SIGNAL: OFF. GOLD SIGNAL: OFF. INTEREST RATE SIGNAL: OFF.
Keep up-to-date during the week at Twitter and StockTwits (links below), where a combined 26,031 people are joining in…
Twitter® Follow Me on Twitter®. Follow Me on StockTwits®.
SP500 Large Cap Index (click chart to enlarge; SPX, SPY):
Survey Says! Sentiment of individual investors (AAII.com) showed a Bull minus Bear percentage spread of -7.16% vs +4.78% last week. This is NOT what we expect to see at all time highs in the markets, at which point investors should be frantic to own stocks, so despite any dip that may occur, the Bull run is not over.
| Thurs. 12 am close to poll | Bulls 30.22% | Neutrals 32.40% | Bears 37.38% |
2. U.S. Small Caps: I sold my small cap position for a quick 3.2% market timing profit when the index reached an overbought level on Friday. It could move higher to test the key 138.82 number or the prior all time high, but this felt like a good place to trade out of a bit of exposure.
I’m not making radical market timing moves, because my longer term view is that the markets move higher as stated.
Russell 2000 U.S. Small Cap Index (click chart to enlarge; IWM, RUT):

Rebounded enough for a sale last Friday.
3. Gold: Gold is levitating near a prior market timing high because rates are falling again, but we have to watch that “white triangle” on the rate chart (see below) to know how things will work out for gold. This may seem dull, but if you want to make money with gold, YOU MUST UNDERSTAND these driving factors.
Interest rates are tied into growth expectations, which are falling of late based on a dovish Federal Reserve during the past FOMC meeting. They are raising rates but are skeptical of the “Trump Growth” phenomenon. This could ironically drive long rates DOWN, not up if they raise rates into slow growth -meaning if they are right and President Trump is wrong. They think the economy can withstand higher rates at this point, although we just came out of a profits recession.
Gold needs negative real rates to thrive. Rising rates (ahead of inflation) in a super strong economy are like kryptonite for gold. If you are not up on “What Makes Gold Shine and Decline..” review it HERE.
Other projections of GDP are much higher than say that of the Atlanta Federal Reserve Bank, back down at about 1.0% GDP last I checked. That is far too weak to support current market levels and profit projections. We’ll find out at 8:30 am ET on April 28th with the first estimate of Q1 GDP.
Gold ETF (click chart to enlarge the chart; GLD):
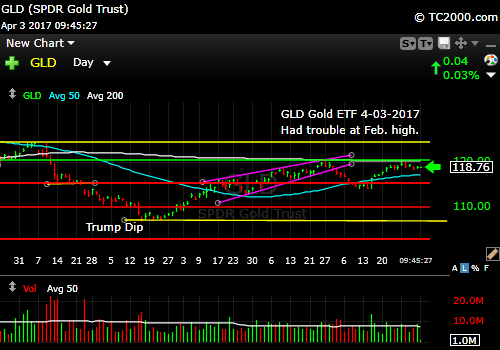
Gold depends on Trump’s failure to thrive. Strong economic growth is like kryptonite for gold.
4. U.S. 10 Year Treasury Note Yield (TNX): We are testing the lower white line in the market timing triangle. That must hold. Below there, we will know that the market believes “Trump Growth” is in trouble. It’s what the MARKET believes that needs to be determined, not what you or I feel politically. I’m an independent, so I evaluate each of the Trump policies one by one without glorification or demonization of the man himself. Nothing great and enduring will be done over the next four years without some measure of compromise.
The 10 Year Yield is at 2.339% as I type this, which is a test BELOW the lower white trend line that forms the base of the triangle shown. The last support levels would be the prior lows shown going back to January. Just breaking the triangle on a closing basis could mean trouble for growth Bulls.
U.S. 10 Year Treasury Note Yield (click chart to enlarge; TNX, IEF, TYX,TLT,TBF):

10 Year Yield now testing base of the triangle.
Thank you for reading. Would you please leave your comments below where it says “Leave a Reply”… or you should also feel free to ask a question…
Note: My monthly newsletter is now CLOSED to new subscriptions until Dec 2017. If all goes as planned, I will reopen the wait list for the end of December/January Issue in December.
Be sure to visit the website for more general investing knowledge at:
Standard Disclaimer: It’s your money and your decision as to how to invest it.
I thank Worden Brothers for the charting system I use to post these charts. If you want to know more about the charting system I use every day, go to my “Other Resources” page here: Other Resources It makes it much easier to follow along with me if you can see the charts and manipulate them on your own computer. It’s a great investment to have an excellent charting system. Check it out with a free trial at the link above.
Copyright © 2017 By Wall Street Sun and Storm Report, LLC All rights reserved.

Thank you for your insight! I try to separate politics from my investment decisions. I just think that a President that says he likes to be unpredictable is a danger to our safety and world peace!