A Market Timing Report based on the 6-16-2017 Close, published Sunday, June 18, 2017
I deliver focused comments on market timing once or twice a week. These are supplemented with daily “Tweets/StockTwits” (see links below).
1. SP500 Index: What did the Fed do? They raised rates 0.25% as expected, but took a hawkish stance according to some, but in fact the Fed lowered their median PCE Core inflation expectation for 2017 from 1.9 to 1.7% and left 2018 and 2019 unchanged at 2.0%. So maybe they are not so hawkish after all. Read the dot plot info at this PDF Link from the FOMC). They currently expect very little additional growth in 2017 over 2016 and a slight DECLINE in real GDP growth going into 2018-2019. I guess they don’t believe in the power behind Trump’s policies yet, but that could change.
What I observed after the Weds. 2 pm Federal Reserve statement release was a market timing outperformance of value over growth in both the small and large cap ETFs as well as an initial outperformance of small over large caps. The latter has since reversed as the following chart shows. Note also small growth is now at the bottom (from Fed Statement Weds. up to 6-16-2017 close):

Value beats growth since the Fed statement was released.
Keep up-to-date during the week at Twitter and StockTwits (links below), where a combined 27,838 people are joining in…
Twitter® Follow Me on Twitter®. Follow Me on StockTwits®.
Now let’s take a longer market timing point of view. Look at what the small caps (IWM, IWO, IWN), midcaps (IJH), and large caps (IWF, SP500, IWD) have done since the February 11, 2016 low. The small caps are all bunched up near the top of the chart, large growth (yellow) beat large value which tracked with the SP500 Index. IJH, the midcaps (purple line) performed at a level between large and small caps. Large growth IWF (yellow line) somewhat bettered the large value stocks.

Longer term winners are the small caps.
Now let’s look at the SP500 Index chart and see where we are after the large tech swoon of the past several trading days. Large caps vibrated in a range ABOVE the last breakout. That is very positive. This further proves my point last week that there was a rotation going on between large cap tech and large cap value stocks. Whether this persists at all is unclear.
SP500 Large Cap Index (click chart to enlarge; SPX, SPY):

Still above last breakout.
If growth continues as the Federal Reserve believes it will, growth stocks should not simply collapse from here. Amazon buying out Whole Foods suggests that the biggest winners are not done continuing to win. Often when a company buys out another company the buyer’s stock falls, but not so with Amazon which was the best performing of the FAANGM stocks (FB, AMZN, AAPL, NFLX, GOOGL, MFST) stocks as shown on this chart I posted HERE.
Survey Says! Sentiment of individual investors (AAII.com) showed a Bull minus Bear percentage spread of +2.79% vs. +5.90% last week. It’s remarkable that the percentage of Bears did not increase (they actually fell very small amount) after the techs swooned on the prior Friday. Investors have been piling into bond funds and ETFs near stock market highs. That is NOT how a Bull market ends, so that would indicate more upside before the Bull fades from sight. We could have a correction given negative news flow from the Trump administration. Go back and review my comparison to the Clinton impeachment period if you believe there is zero short term risk to the market. Note that I have not brought down my exposure level, because I still feel with a Republican controlled House, it would require a high burden of proof to impeach the president.
I don’t like the way the President is handling the investigation. Instead of cheering on the investigators to clean house for him, President Trump is locking horns with the entire intelligence community and criticizing Special Prosecutor Mueller. He would get far more done if he were to get out of his own way. If he is not guilty, he should do a purge of his administration of any involved in Russian collusion and be done with it, so the Congress can focus on the business of the people. Let’s get on with tax and healthcare reform.
| Thurs. 12 am close to poll | Bulls 32.27% | Neutrals 38.25% | Bears 29.48% |
2. U.S. Small Caps: Small caps triggered the “Stock Market Timing Signal” to ON, and it remains on despite the Big Tech swoon, which is impressive. We can still test the orange line and survive (see chart), but we should not break it again, or we may be retesting the bottom of the previous range (133.12ish) or worse.
Russell 2000 U.S. Small Cap Index (click chart to enlarge; IWM, RUT):
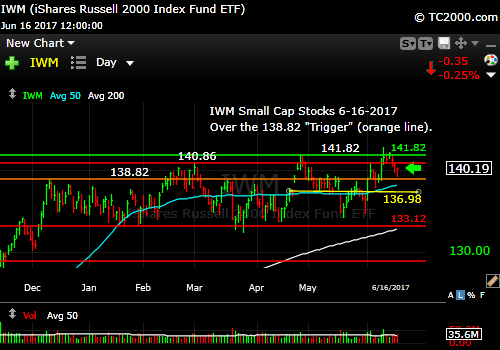
Small caps hold onto breakout.
3. Gold: The “Rate Signal” is OFF, and despite that, gold is selling off. Gold initially rallied right after the Fed statement, but then when it became clear the Fed was leaning hawkish, gold fell a bit. If rates stay as low as they are now (below the orange line in the rate chart below), or head lower, gold could well rise again. Gold should not fall apart while rates are falling, because negative real interest rates are what gold loves.
Gold ETF (click chart to enlarge the chart; GLD):
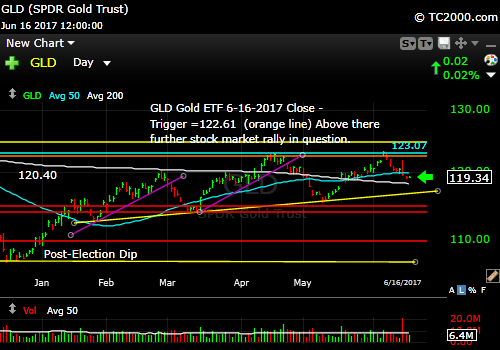
Gold slipping despite rate signal being OFF.
4. U.S. 10 Year Treasury Note Yield (TNX): Rates did NOT spike much after the Federal Reserve FOMC Statement was released. They raised the Fed Funds rate by 0.25% as expected, but continued to believe that more rate hikes are necessary than the market foresees for 2017. Remember the 10 Year Yield fell after each of the prior two Fed hikes. This time, as mentioned above, they lowered their median inflation expectations. Review the data for yourself via the PDF link I posted above.
The Fed has started talking about rolling off their $4.5 Trillion balance sheet. If the Fed does start reducing its purchases of US long dated Treasuries, I expect rates at the long end to creep up as they also continue slowly raising the short end via the Fed Funds rate.
Overall, significant inflation is not rearing its ugly head in a big way, despite the fact that some costs like rent have jumped quite a bit over the past few years.
What if inflation remains as subdued as it is now? Bonds and Treasuries could trade sideways and if the economy does pick up steam as expected, the stock market will do very well and gold will suffer to the extent that real returns are better elsewhere. Gold remains a form of currency insurance for me and I have no gold trade on at this time.
MY SIGNAL SUMMARY for a Further U.S. Stock Market Rally is:
Stock Signal ON, Gold signal ON (good for stocks, not gold), Rate Signal OFF (good for bonds).
U.S. 10 Year Treasury Note Yield (click chart to enlarge; TNX, IEF, TYX,TLT,TBF):

Rates stay below trigger post-Fed statement.
Thank you for reading. Would you please leave your comments below where it says “Leave a Reply”… or feel free to ask a question… Pay it forward too by sending the link to MarketTiming.Blog to a relative or friend. Thank you.
Note: My monthly newsletter is now CLOSED to new subscriptions until late this year. I’ll let you know here if and when it reopens.
Be sure to visit the website for more general investing knowledge at:
Standard Disclaimer: It’s your money and your decision as to how to invest it.
I thank Worden Brothers for the charting system I use to post these charts. If you want to know more about the charting system I use every day, go to my “Other Resources” page here: Other Resources It makes it much easier to follow along with me if you can see the charts and manipulate them on your own computer. It’s a great investment to have an excellent charting system. Check it out with a free trial at the link above.
Copyright © 2017 By Wall Street Sun and Storm Report, LLC All rights reserved.
