A Market Timing Report based on the 6-09-2017 Close, published Sunday, June 11, 2017
I deliver focused comments on market timing once or twice a week. These are supplemented with daily “Tweets/StockTwits” (see links below).
1. SP500 Index: A “Bearish engulfing pattern” is a market timing pattern in which the price on a given day makes a higher high and a lower low and closes near the low. The pattern on Friday in the midst of strong profit taking in Big Tech names did NOT qualify as such a pattern, as the SP500 Index was nearly unchanged for the day. There was a higher high and a lower low, but the close was at 0.08% for the day.
Rallies in energy (XLE), financials (XLF), materials (XLB), healthcare (XLV), and industrials (XLI) balanced out the losses in other sectors, but primarily in tech (XLK) at -2.47% vs. the next poorest performer, consumer discretionary (XLY) at -0.44%. Consumer staples (XLP) were -0.12% and utilities (XLU) -0.09%.
Was that it for the tech sell-off? The technicals suggest there is room for a bounce early next week ahead of the Fed’s action on Wednesday, which will be to raise rates by another 0.25% to a target range of 1.00-1.25% per CME stats that say the odds are 99.6%.
It’s what the Federal Reserve says in its FOMC statement out at 2:00 pm this Weds. about future rate hikes that could make a difference to the markets, along with the dog and pony show at 2:30 pm ET. Current projections are for stronger GDP numbers over the current and subsequent quarter or two. The thing that could hold this back is that businesses had been counting on a successful tax cut package to stimulate growth, but with President Trump mired in trouble over the Russian investigation, visibility has shrunk. The market does not appreciate political fog, and may this may raise the risk for more than a quick dip in the market. At the same time, I still expect higher highs in the market before this Bull run is over. Sentiment is too “mildly Bullish” as you’ll see below to make this a top…
What I observed Friday morning which continued to the close was that money was rotating from Big Tech Growth (QQQ) at – 2.50% for the day to midcaps (IJH) +0.37% and small caps (IWM) +0.52%. As said, the SP500 Index was only -0.08% for the day.
There was also a rotation from growth to value across the board, even among the large caps. There could be some further rotation from large cap tech growth stocks into small and midcap stocks and even to large caps with better value. On Friday SCHG (Schwab Large Cap Growth) was -0.89%, while SCHV (Schwab Large Cap Value) was +0.54%. This was also true among small caps with IWO (Small Growth) DOWN 0.43% and IWN (Small Value) UP a big 1.38%.
Again, that’s not a “market sell-off”; it’s a market timing rotation from Big to Mid and Small and from Growth to Value.
Keep up-to-date during the week at Twitter and StockTwits (links below), where a combined 27,674 people are joining in…
Twitter® Follow Me on Twitter®. Follow Me on StockTwits®.
SP500 Large Cap Index (click chart to enlarge; SPX, SPY):

SP500 still near all time high.
Survey Says! Sentiment of individual investors (AAII.com) showed a Bull minus Bear percentage spread of +5.90% vs -4.62% vs last week. Tops don’t look like this! There’s more Bull Market to come, even if we see a Trump-based correction. I personally sense that it will be hard to prove anything against Trump if there are no recordings as it’s simply Comey’s word against his. Furthermore, the Republicans control the House, which would have to impeach Trump to kick him out, as a sitting President cannot be indicted by a prosecutor, as indictment was felt by the founders to be an easy way to disrupt and destabilize the government. There would have to be incontrovertible evidence of obstruction of justice for impeachment by the House and then trial by the Republican Senate to convict.
The only pause I have is that the former Federal prosecutor from New York, Preet Bharara said on MSNBC today that no one can conclude yet whether there IS or IS NOT sufficient evidence for obstruction of justice by Trump. We’ll have to wait and see. Waiting is NOT something the market enjoys…
| Thurs. 12 am close to poll | Bulls 35.43% | Neutrals 35.04% | Bears 29.53% |
2. U.S. Small Caps: Small caps triggered the “Stock Market Timing Signal” to ON, but will have to quickly make a brand new high above the green line in the chart below to confirm the “rotation” was more than a one day thought. Remember too that in a healthy rally, all indices tend to rise together, even if some under-perform others.
Russell 2000 U.S. Small Cap Index (click chart to enlarge; IWM, RUT):

Small caps win in the rotation from large to smaller (IJH and IWM) on Friday.
3. Gold: The “Rate Signal” (see TNX below) started to flicker at the end of the week. So did the GLD market timing signal as it was OFF (above trigger) on Tuesday and off by the next day after a failed breakout. The reaction to the Federal Reserve’s rate hike will depend on the extent of their perceived hawkishness. What we know regardless is gold sold off after just ONE DAY above my trigger line. It was a market timing fake-out. This happened because rates were UP for three days in a row. Guess what? Gold was down three days in a row. If you follow gold, you must follow interest rates!
If we have a tax reform package by August (looking bleaker), rates could continue higher, which generally is bad for gold which yields zero. A freeze in DC won’t be liked by the stock market, but gold would appreciate it. DC stagnation could send rates even lower and gold could benefit. If things work out for Trump, in the short term you’ll see gold move lower, but long term we’ll have TrumpFlation and gold will respond by rallying. I see gold as currency insurance still for the Trump “giveaway” plan, creating tax cuts we cannot afford. He’s no fiscal conservative. He himself says “I love debt!” It will be tricky to trade gold in the near term, unless you stick very diligently to buying only the oversold levels and then selling the overbought levels such as the one we just had.
Gold ETF (click chart to enlarge the chart; GLD):
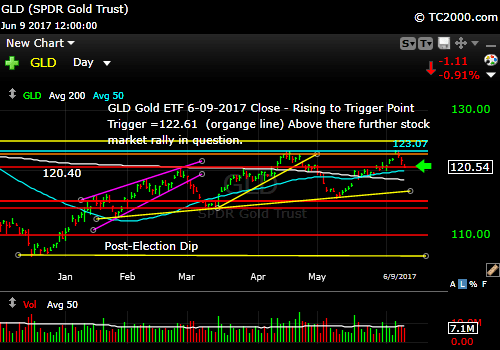
Gold fails a key breakout.
4. U.S. 10 Year Treasury Note Yield (TNX): As I detailed last week, the Fed’s hikes in December and March have led to LOWER 10 Year Treasury yields. We can expect the same if the Fed raises rates again as expected by nearly every breathing human economist. Rates will rise at the longer end if growth picks up and the Fed finds itself behind the curve or if the bond market sees that coming. The market discounts the future whether it arrives or not!
The 10 Year Yield was “playing with my number,” last week flickering from OFF to ON on both Thursday and Friday and then falling back below the trigger line (orange line on chart below) to OFF. Long rates are EVENTUALLY likely to rise a bit as the Fed continues to raise short rates as long as growth continues and the Fed action does not shut growth down prematurely. They won’t be able to roll off their huge balance sheet if they don’t raise rates. If the Federal Reserve falls too far behind on rate increases when things are good, they won’t have as much room to act if things turn south in the economy. It’s quite a balancing act and they actually have little visibility as to the impact of their policy moves. Their GDP predictions are all over the place vs. reality, nearly worthless in the end. That is why we follow market timing signals and try to avoid over-analyzing everything else. Profits matter. Actual printed economic numbers matter, but projections don’t as much! In the end the market price itself is the great truth teller! They cannot hide price, volume, or volatility. It’s all there for us to see.
MY SIGNAL SUMMARY for a Further U.S. Stock Market Rally is:
Stock Signal ON, Gold signal ON (good for stocks, not gold), Rate Signal OFF (good for bonds).
U.S. 10 Year Treasury Note Yield (click chart to enlarge; TNX, IEF, TYX,TLT,TBF):

Rate signal back OFF, but barely.
Thank you for reading. Would you please leave your comments below where it says “Leave a Reply”… or feel free to ask a question… Pay it forward too by sending the link to MarketTiming.Blog to a relative or friend. Thank you.
Note: My monthly newsletter is now CLOSED to new subscriptions until late this year. I’ll let you know here if and when it reopens.
Be sure to visit the website for more general investing knowledge at:
Standard Disclaimer: It’s your money and your decision as to how to invest it.
I thank Worden Brothers for the charting system I use to post these charts. If you want to know more about the charting system I use every day, go to my “Other Resources” page here: Other Resources It makes it much easier to follow along with me if you can see the charts and manipulate them on your own computer. It’s a great investment to have an excellent charting system. Check it out with a free trial at the link above.
Copyright © 2017 By Wall Street Sun and Storm Report, LLC All rights reserved.
