A Market Timing Report based on the 7-14-2017 Close, published Sunday, July 16th, 2017
I deliver focused comments on market timing once or twice a week. These are supplemented with daily “Tweets/StockTwits” (see links below).
1. SP500 Index: The SP500 Index is at new market timing highs, while small caps are above my Bullish “Signal Trigger Line,” but hesitating to break out further. They may yet come along for the ride. Rates fell after the Federal Reserve Chair Yellen sounded more dovish on the margin in her testimony before Congress this week, and the banks and financials, which depend on their interest rate margins for income sank. Inflation as measured by the Consumer Price Index was flat in June month over month and CPI was up 1.6% Y/Y while core CPI was up 1.7% Y/Y. We are about 2 weeks away from the Q2 GDP 1st estimate results. The market may be buoyed by positive earnings before then, and continue rallying further based on solid GDP results. There is a Fed meeting on July 25-26 before GDP on 7-28, but they are not likely to hike again that soon given their comments this past week.
Keep up-to-date during the week at Twitter and StockTwits (links below), where a combined 28,641 people are joining in…
Twitter® Follow Me on Twitter®. Follow Me on StockTwits®.
SP500 Large Cap Index (click chart to enlarge; SPX, SPY):

New breakout to upside.
Survey Says! Sentiment of individual investors (AAII.com) showed a Bull minus Bear percentage spread of -1.39% vs. -0.28% last week. Read my comment from last week. It still applies. The high neutral rate itself is very positive.
| Thurs. 12 am close to poll | Bulls 28.24% | Neutrals 42.13% | Bears 29.63% |
2. U.S. Small Caps: I lightened up my equity exposure on Thursday 7-12-2017 after adding exposure back during the swoon to the low end of the recent market timing trading range on 7-6. I am using IWM and most recently, QQQ put selling to make some trading profits, because the beta and therefore the extent of the swings up and down for these indexes is higher than for the SPY for example. The failure to break up through the green line noted in the chart below is a negative. I will likely add back some small cap exposure if we achieve another breakout. Note the volume decline on the narrow price rise over the past three days, also a negative.
Russell 2000 U.S. Small Cap Index (click chart to enlarge; IWM, RUT):

Failed breakout. Need a breakout soon to keep the upward momentum.
3. Gold: Last time I reported here, rates were rising and gold was falling and now we have the reverse going on in market timing terms. A breakout above the orange line, and because it is close by, a second breakout above the aqua line will spell a real change of character for gold. Note that GLD rose and tested the prior up trend line from below and pulled back a bit. That itself is a possible short set-up (with a stop), but the fact that the May low held is a positive working against that. We have a trading range until the previously mentioned breakouts occur.
Gold ETF (click chart to enlarge the chart; GLD):

Gold subject to interest rates as usual.
4. U.S. 10 Year Treasury Note Yield (TNX): Rates fell on the recent dovish Federal Reserve comments although they remain above my “Market Timing Signal Trigger Line” (orange line in chart below). I believe if earnings remain solid (banks were so so on Fri.) as we head into the main part of earnings season, rates could test around the April or May lows to create a reverse head and shoulders formation, and then rally again. Fiscal stimulus may be required to drive rates back above that green line on an intermediate term basis. Investment in higher productivity is much better for our economy longer term.
Just providing tax cuts to boost spending is a temporary fix that weakens the nation’s balance sheet in the end. It is short sighted. Infrastructure spending could boost productivity a bit, but such moves mean little when compared to innovation and research and development with resulting new products/greater productivity.
But what kind of education do we need? Better education could be along the lines Trump has been pushing to mimic the German Hochschule model, which trains workers with specific skills instead of sending kids off to 4 year Beerfests, would allow for more of the 6 MILLION open jobs to be filled. Students who represent the upper cut of students could attend the “University” system and go on to masters and doctorate degrees. We are not about to achieve high levels of productivity with an ignorant, unskilled nation, or “Idiocracy,” to borrow a satirical movie title.
U.S. 10 Year Treasury Note Yield (click chart to enlarge; TNX, IEF, TYX,TLT,TBF):
Top line reads “Treasury Yield 7-14-2017 Close, Trigger line…”
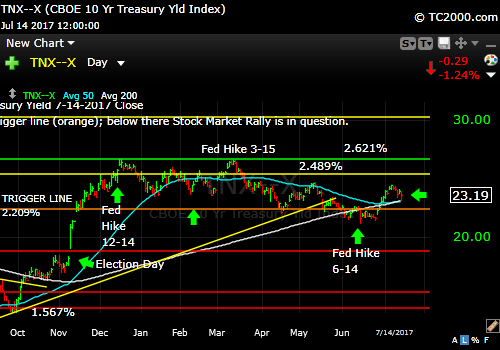
Rates falling back toward the orange trigger line.
Let’s review the three market timing signals together….
MY SIGNAL SUMMARY for a Further U.S. Stock Market Rally is:
Stock Signal ON, Gold signal ON (good for stocks, not gold), Rate Signal ON (good for stocks, not bonds).
Thank you for reading. Would you please leave your comments below where it says “Leave a Reply”… or feel free to ask a question… Pay it forward too by sending the link to MarketTiming.Blog to a relative or friend. Thank you.
Note: My monthly newsletter is now CLOSED to new subscriptions until late this year. I’ll let you know here if and when it reopens.
Be sure to visit the website for more general investing knowledge at:
Standard Disclaimer: It’s your money and your decision as to how to invest it.
I thank Worden Brothers for the charting system I use to post these charts. If you want to know more about the charting system I use every day, go to my “Other Resources” page here: Other Resources It makes it much easier to follow along with me if you can see the charts and manipulate them on your own computer. It’s a great investment to have an excellent charting system. Check it out with a free trial at the link above.
Copyright © 2017 By Wall Street Sun and Storm Report, LLC All rights reserved.

Thanks David!
You are welcome Charles. Thanks for reading!