A Market Timing Report based on the 9-15-2017 Close, published Sunday, September 17th, 2017
I deliver focused comments on market timing once or twice a week. These are supplemented with daily “Tweets/StockTwits” (see links below). Updated Q3 GDP discussion.
1. SP500 Index: The Conference Board of “Leading Economic Indicators” for the U.S. ticked up a bit more, up 0.3% for July, vs. 0.6% for June and 0.3% in May. The Conference Board believes this augers well for more second half growth in 2017 as discussed HERE. Our decision to remain long this market via market timing has served us well, including raising exposure ahead of the 2016 election.
It is very positive that small caps are again above my “Trigger Line.” This market timing signal is significant, because it means the rally is broadening to smaller cap stocks. Mid caps previously back-tested the Dec. 8th high (for IJH it was 169.86), and are above their trigger line as well, further substantiating the health of the rally. Here’s the “But.” “But” both small and mid caps need to proceed to make new highs now. If they fail at a right shoulder below their all time highs, it will be bad news for the continued large cap stock rally. I’ll be keeping an eye on this all this week.
It is of note that IYT, the Transportation ETF, has just formed a right shoulder vs. the March 1st high. You can see it in a chart of the Dow Jones Transportation Index as well (not shown here). As many of you know, classic Dow Theory says that the Transports must now confirm the new market timing high we have in the Dow Jones Industrial Index. They have not yet done so. These signals are important to watch.
Another thing that bears watching are falling estimates for Q3 SAAR GDP, which on Friday fell to 1.34% for the NY Federal Reserve Bank and to 2.2% for the Atlanta Federal Reserve Bank. Slower retail sales took off a bit of growth, and with over twice the impact, industrial production and capacity utilization fell. The Year over Year US GDP numbers are more steady than the seasonally adjusted annualized rates, which tend to jump up and down along their trend, and are still in the low 2’s for both Fed Banks, not the 3% that the Trump administration would like to see.
Please note that the NY Fed was about 1% too low for Q2 SAAR GDP (the Atlanta Fed does not post the prior data to compare, but their numbers have been off by a mile at times), so take these “predictions” with a grain of salt.
Review the SP500 Index market timing chart below and then we’ll discuss investor sentiment and the small caps…
Keep up-to-date during the week at Twitter and StockTwits (links below), where a combined 30,494 people are joining in…
Twitter® Follow Me on Twitter®. Follow Me on StockTwits®.
SP500 Large Cap Index (click chart to enlarge; SPX, SPY):

US Large Caps at an all time high.
Survey Says! Sentiment of individual investors (AAII.com) showed a Bull minus Bear percentage spread of +19.3% vs -6.46% last week, which reflects a big boost in the number of Bulls and about the same fall in the number of Bears. Neutrals were up less than 2%.
There is still room for the spread to rise, though the easy gains may have passed during this swing up in the market. If you have not yet learned to buy the dips with me, please learn that lesson. Don’t chase!
Spreads of Bulls minus Bears can reach over 30% during periods of Bullishness. During giddy times like 2000, the peak sentiment spread was a crazy 61.7% for the study ending 1-05-2000. You would think we would not get back to those levels ever again, but investors and traders have short memories when it comes to greed.
| Thurs. 12 am close to poll | Bulls 41.29% | Neutrals 36.74% | Bears 21.97% |
2. U.S. Small Caps: Small caps back-tested the “Trigger Line,” but made more progress this week to the upside. They need to avoid failing at a right shoulder matching the June high in the market timing chart below. Overall, their participation in the broadening rally is very positive. Again, a brand new market timing high is needed to reinforce this rally. (UPDATE: Testing above prior all time high this morning on 9-22-2017 of 144.25, but barely above it. IWO is testing above its prior high of 173.93. Watch for both of those to hold on one to three closes for confirmation; the more the merrier. If you add on the breakout which we usually do in smaller size than our buy lower, use a mental stop and exit a reversal if you plan on trading it!)
Russell 2000 U.S. Small Cap Index (click chart to enlarge; IWM, RUT):
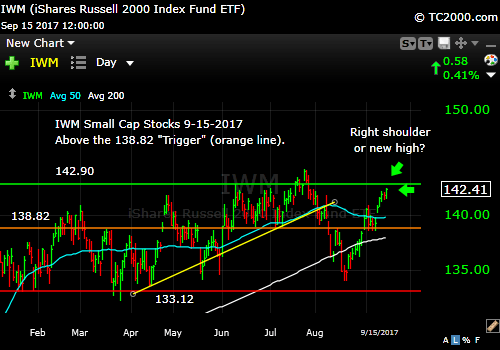
Small caps need to avoid failing at a a right shoulder.
3. Gold: Interest rates were UP for the past 6 day period, and gold was down. Got the picture. See my post from two weeks ago on this relationship. A reversal to the downside as opposed to a back-test of that upper yellow line in the chart below would be a negative market timing event. If inflation gets ahead of the Fed, gold can still do well in a rising rate environment, but if the Fed hikes early and lowers its balance sheet exposure, gold will be setting off numerous market timing signals on its way down again. Watch your profits with mental stops.
Gold ETF (click chart to enlarge the chart; GLD):

Gold down on UP interest rates.
4. U.S. 10 Year Treasury Note Yield (TNX): My call 2 weeks ago that rates would correct UPWARD was correct.
US Median Housing prices are now well above the prior 1 year average at the prior all time high during the housing bubble. Rents have shot up much since then, much faster than overall inflation. The Fed cannot ignore these facts much longer as the bubble in housing was the reason for the Great Recession in the first place.
The Federal Reserve has managed to reinflate housing with the help of speculators, some large and many small. Low interest rates have done that, just as they have contributed to all time highs in the U.S. stock market.
The remaining force that can prop up the housing market now, at least for a while) is the lack of inventory. Builders did not build over the past few years at the clip they did prior to the crisis. Still, if the Fed persists in its dovish policy, housing prices will escape even further beyond the reach of buyers. If the Fed raises rates now to head this off, housing prices will moderate and likely fall as housing investors/speculators bail at the margin.
Now we need to review our three signals (below the chart after you review it…)
U.S. 10 Year Treasury Note Yield (click chart to enlarge; TNX, IEF, TYX,TLT,TBF):

Rates bouncing again.
Let’s review the three market timing signals together….
MY SIGNAL SUMMARY for a Further U.S. Stock Market Rally:
Stock Signal ON (Small Caps above “Trigger Line”; a broad rally is a positive for stocks).
Gold Signal OFF (GLD above the “Trigger line” which is good for gold, not stocks).
Rate Signal OFF but BARELY (10 Year Yield below the “Trigger Line,” good for bonds, not stocks). This bounce means we could trigger this signal back to ON again, although the signal change attempted Friday failed to hold by the close.
P.S. I’m back in the saddle after Irma. Winds reached low Category 2 levels where I was located in Florida. Shingles and various other roofing materials, some lined by scores of nails were flying by at high speeds of over 100 mph for several hours in the middle of the night, early Monday morning. The damage was very real for many, so please be generous and help others out. How we serve others is what defines us. I did post during the week on social media, so please always keep in touch there (links below). Thanks for your patience and for your support.
Thank you for reading. Would you please leave your comments below where it says “Leave a Reply”… or feel free to ask a question… Pay it forward too by sending the link to MarketTiming.Blog to a relative or friend. Thank you.
Note: My monthly newsletter is now CLOSED to new subscriptions until late this year. I’ll let you know here if and when it reopens.
Be sure to visit the website for more general investing knowledge at:
Standard Disclaimer: It’s your money and your decision as to how to invest it.
I thank Worden Brothers for the charting system I use to post these charts. If you want to know more about the charting system I use every day, go to my “Other Resources” page here: Other Resources It makes it much easier to follow along with me if you can see the charts and manipulate them on your own computer. It’s a great investment to have an excellent charting system. Check it out with a free trial at the link above.
Copyright © 2017 By Wall Street Sun and Storm Report, LLC All rights reserved.
