A Market Timing Report based on the 9-22-2017 Close, published Sunday, September 24th, 2017
I deliver focused comments on market timing once or twice a week. These are supplemented with daily “Tweets/StockTwits” (see links below).
1. SP500 Index: The Federal Reserve held the Fed Funds rate steady this week as expected, but will be starting to unwind its balance sheet in October. As detailed at Investopedia, “$1.4 trillion of the $2.5 trillion in Treasuries have maturities of less than five years.” This means the money that drove this rally will be withdrawn over several years. The Fed will roll off $6 Billion in maturing Treasuries and $4 Billion in mortgage backed securities per month and each quarter they will raise that total of $10 B by another $10 B until $50 B/month is reached.
On the technical market timing side of things, this week the small caps gave us the further market timing confirmation I was looking for in last week’s post. Please read it HERE as I will not rehash it. (Also, please read the small cap section below.)
Last week I noted IYT, the Transportation ETF, had just formed a right shoulder vs. the March 1st high, but it’s above it now, soon to re-challenge the prior all time high.
In the past week, estimates for US Q3 SAAR GDP, rose from 1.34% for the NY Federal Reserve Bank to 1.56%, due to an increase in building permits, which is still low, and the estimate remained at 2.2% for the Atlanta Federal Reserve Bank. As long as we are growing at 2% or more, the US equity market should be OK. If the NY Federal Reserve is right, the stock market may not like it and react poorly. They’ve been very wrong before.
Despite the “Threat War” going on between President Trump and Kim of North Korea, the market is not particularly shaken. A threat of a hydrogen bomb test by North Korea in the Pacific was made yesterday, and we’ll have to watch the market’s response in the futures tonight. North Korea remains a bit of a wild card, despite the lack of apparent military options. It is hard to account for insane behavior by Trump or Kim in an investment plan other than to own some gold and bonds at reasonable levels.
Review the SP500 Index market timing chart below and then we’ll discuss investor sentiment and the small caps…
Keep up-to-date during the week at Twitter and StockTwits (links below), where a combined 30,690 people are joining in…
Twitter® Follow Me on Twitter®. Follow Me on StockTwits®.
SP500 Large Cap Index (click chart to enlarge; SPX, SPY):
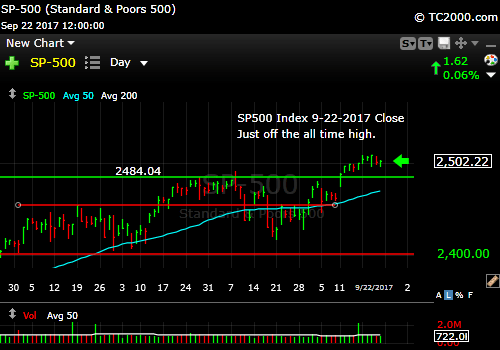
SP500 Index still near the all time high
Survey Says! Sentiment of individual investors (AAII.com) showed a Bull minus Bear percentage spread of +12.93% vs +19.3% last week. Investors became more Bearish at the high of the week, which is NOT how Bull markets end, as I say. Bulls are killed by wild optimism. I admit, this does not preclude corrections along the way. We’ve had several along the way since the 3-2009 bottom.
| Thurs. 12 am close to poll | Bulls 40.14% | Neutrals 32.65% | Bears 27.21% |
2. U.S. Small Caps: Refer back to last week’s post (link to upper right) for my update. Both IWO and IWM made my stated goals. We will add more small cap exposure on further confirmation of this breakout. This trend is a further confirmation of the long Bull market we are in and the fact that it is NOT over.
The negative? The close leaves us with a tiny market timing breakout of only 0.05 points. We need more than that.
Russell 2000 U.S. Small Cap Index (click chart to enlarge; IWM, RUT):

Small Caps lead the way higher.
3. Gold: I told you to watch your gold profits, and I was correct. Higher interest rates minus extreme inflation is a bad set-up for gold. The only plus is that GLD tested my “Trigger Line” of 122.61 and passed the test, at least for the first time. It’s a negative, however, that GLD closed below 123.31, which was the prior breakout level. The close was 123.24. Gold must rally from here, or I would take more profits off the table.
Gold ETF (click chart to enlarge the chart; GLD):
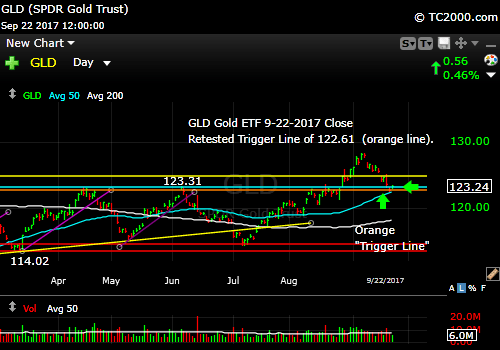
Gold is down on the Fed going ahead with balance sheet runoff.
4. U.S. 10 Year Treasury Note Yield (TNX): Rates should go still higher or the stock market rally will be in trouble. I have used fundamental considerations as well as market timing signals to reduce my muni bond exposure of late.
If you are holding INDIVIDUAL bonds that were issued by strong companies or municipalities, you’ll probably do OK even if you give up a bit of interest rate opportunity. I am talking about bond funds that go down when everyone is selling because bonds are illiquid and movements are exaggerated when “everyone is selling.”
Now we need to review our three signals (below the chart after you review it…)
U.S. 10 Year Treasury Note Yield (click chart to enlarge; TNX, IEF, TYX,TLT,TBF):

Rates rising.
Let’s review the three market timing signals together….
MY SIGNAL SUMMARY for a Further U.S. Stock Market Rally:
Stock Signal ON (Small Caps above “Trigger Line”; a broad rally including small and mid cap stocks as well as large caps is a positive for stocks).
Gold Signal OFF (GLD above the “Trigger line” which is good for gold, not stocks – but gold must immediately rally as discussed above).
Rate Signal ON (10 Year Yield above the “Trigger Line,” good for stocks, not bonds).
Thank you for reading. Would you please leave your comments below where it says “Leave a Reply”… or ask a question… Pay it forward too by sending the link to MarketTiming.Blog to a relative or friend. Thank you.
Note: My monthly newsletter is now CLOSED to new subscriptions until late this year. I’ll let you know here if and when it reopens.
Be sure to visit the website for more general investing knowledge at:
Standard Disclaimer: It’s your money and your decision as to how to invest it.
I thank Worden Brothers for the charting system I use to post these charts. If you want to know more about the charting system I use every day, go to my “Other Resources” page here: Other Resources It makes it much easier to follow along with me if you can see the charts and manipulate them on your own computer. It’s a great investment to have an excellent charting system. Check it out with a free trial at the link above.
Copyright © 2017 By Wall Street Sun and Storm Report, LLC All rights reserved.
