A Market Timing Report based on the 10-13-2017 Close, published Saturday, October 15th, 2017
I deliver focused comments on market timing once or twice a week. These are supplemented with daily “Tweets/StockTwits” (see links below).
1. SP500 Index: The markets were largely in a market timing consolidation this week (moving sideways) as recent big gains are being digested. The small caps eased down a bit more than the large caps, but within their higher volatility range, held up well enough to allow the rally to continue.
BUT there is a threat to the rally as I discussed last week in some detail HERE. The slipping sound heard on Friday was by interest rates which headed back down rather than up. As I’ve said, rates rising is one of the things we need to see for the stock market rally to continue, because the financial sector depends on it, and because it means the economy is continuing to expand, which naturally drives rates up. It is a complete misconception that when rates rise, the market does poorly. It is true that rates have never been this low for this long, but the Federal Reserve intends to move them up slowly to avoid market volatility that would be injurious to the economy.
Remember that our “fail safe” is market timing. When things are turning sour, we’ll see it in the charts before the market falls more quickly. That’s not a 100% guarantee, but it’s usually the case. Even in 1987, I saw the damage coming ahead of time. Initially investors won’t believe the changes in the market that we will be able to see. Why can we do this? Because the markets cannot hide three things: Price, volume and volatility. These are derived directly from market trading and cannot be hidden by Wall Street exchanges or anyone else. Market timing data is the one thing the clever people on Wall Street cannot take away from us.
You can be sure, as I’ve been doing technical analysis formally and steadily since 2001, that I will continue to follow and report on what the markets are actually doing, not what people think they should do.
After you review the large cap chart below, have a look at what small caps are doing.
Keep up-to-date during the week at Twitter and StockTwits (links below), where a combined 31,259 people are joining in…
Twitter® Follow Me on Twitter®. Follow Me on StockTwits®.
SP500 Large Cap Index (click chart to enlarge; SPX, SPY):

Stocks holding gains! Rally is still on.
Survey Says! Sentiment of individual investors (AAII.com) showed a Bull minus Bear percentage spread of +12.90% vs. +2.80% last week. Bears gave up about 6 points with about 4 points going to the Bulls and a bit less than 2 to the Neutrals. Rallies don’t end at these levels. There are more gains ahead in my opinion (short of unforeseen disasters like a resumption of war with North Korea – yes, resumption as we never signed a peace agreement with them!).
| Thurs. 12 am close to poll | Bulls 39.77% | Neutrals 33.33% | Bears 26.90% |
2. U.S. Small Caps: The 10-09-2017 low is likely the base of the current U.S. small cap consolidation in market timing terms. If you look at a magnified chart, you’ll see that. The point is that the slight dip in IWM last week is still part of a consolidation, not a breach of the trend.
The mid caps are even stronger as you can tell by examining the IJH chart on your own. This means the rally is intact with great breadth (large down to small cap participation). So we can check off the “Breadth Box.”
Russell 2000 U.S. Small Cap Index (click chart to enlarge; IWM, RUT):
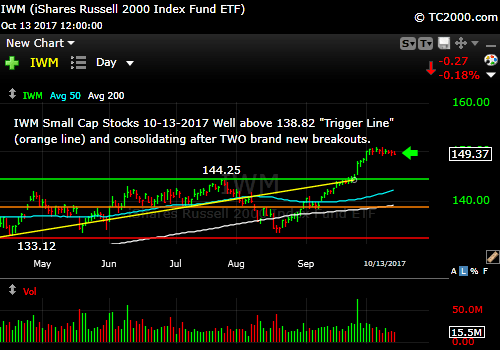
Small caps slipping a bit, but rally is not broken.
3. Gold: UPDATE 10-17-2107: Gold has pulled back below the “Trigger Line” (you can see the number in the chart below). A close below the 10-11-2017 low will reverse the trading signal in my view. That is called a “fakeout.” Some breakouts are fakeouts, because markets test just above them and reverse. Gold is still fine as insurance against the US Dollar and other fiat currencies, but I make a distinction on trades vs. insurance.
Gold visited its market timing trend line (yellow) two Fridays back and then bounced as rates fell from their peak simultaneously (though the bond market was closed this past Monday). This dance is a continuation from what we’ve seen for some time, which is an inverse trading relationship between gold and interest rates.
This echoes the threat to stocks I spoke of above. Gold rising above my trigger is bad for the Trump Growth Thesis and negative for stocks. Falling rates are not what the doctor ordered. Rates should continue to rise in an expanding economy as the Federal Reserve raises rates.
I have mentioned the inflation scenario under which rates could rise while gold also rises. That could happen if the Federal Reserve falls behind on inflation. That does NOT seem to be the case at this time however, as the CPI is running at 2.2%, as reported this past Friday, and core CPI is running at 1.7%.
The measure of inflation the Fed prefers to watch is the 12 month change in Core PCE Prices (Price Index for Personal Consumption Expenditures (PCE)) which was last reported at 1.3%, far below their 2% target. Dr. Yellen reviewed the inflation problem today in fact as posted HERE. She pointed out that PCE Inflation (the change over 12 months) had reached 2.0% earlier in the year, while Core PCE Inflation had hit 1.9%. The drop to 1.3% since then has puzzled the Fed.
Although the Federal Reserve would like to normalize rates, they are cognizant of the fact that the bond market could end up disagreeing, so there is always an out. She says they do not plan to fidget with the balance sheet rebalancing mechanism as they do with the Fed dictated interest rates, but also reserves the right to slow that down and even reverse the flow if the economy does not do what they expect it to do.
That should address anyone who thought the entire path the Fed is now on was immutable. It’s not. They simply want to raise rates “while they can,” so that when they need to lower them, they can impact the economy to steady it. It IS a manipulation and it is NOT a free market principle that drives it NO, which is why we have gold, and for the adventurous currency pioneers, a smaller amount of cryptocurrency on a percentage basis, as insurance.
The bottom line is this: if rates move back up from here and reach a new high, gold will suffer. This means any current gold trade could be cut off in just days to a week or two. Watch the interest rate chart below to figure out where gold will go, as they are firmly LINKED in an inverse relationship – higher rates means lower gold.
As far as market timing goes, gold is back to an up trend, also trading above my “Trigger Line” for Trump Growth.
Now after reviewing the gold chart, have a look at the interest rate market timing signal…
Gold ETF (click chart to enlarge the chart; GLD):
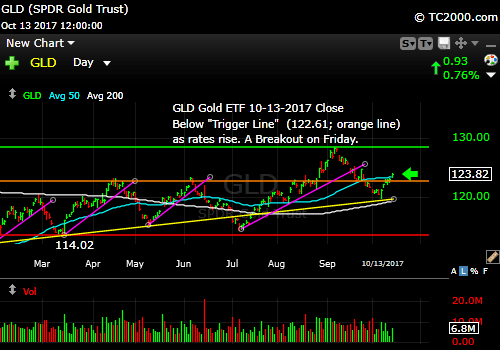
Gold rises above my Trigger Line again!
4. U.S. 10 Year Treasury Note Yield (TNX): The 10 Year Treasury Yield could now back-test that orange line in the chart below that represents the “Trump Growth Trigger Line” for rates. I told you last week, we could see a bigger drop in rates after it hit the overhead resistance line (the horizontal aqua line in the chart below; see last week’s issue).
This market timing move in rates could take us to the orange Trigger Line or perhaps to the red line below that, which would create a reverse head and shoulders formation, allowing for a bounce. Could yields plunge still lower? If Trump can keep legislative momentum on tax reform going, we should not revisit or break the September low. If we do, the stock market will already be well into a deeper correction. My favored scenario is a test no lower than the area of the orange Trigger Line or close to it, meaning the April low.
The markets will do what they want, so we stay alert. Stay tuned on social media with me this week (links above)!
Now we need to review our three market timing signals (below the chart after you review it…)
U.S. 10 Year Treasury Note Yield (click chart to enlarge; TNX, IEF, TYX,TLT,TBF):

Rates are heading in the WRONG direction.
Let’s review the three market timing signals together….
MY SIGNAL SUMMARY for a Further U.S. Stock Market Rally:
Stock Signal ON (Small Caps above “Trigger Line”; a broad rally including small and mid cap stocks as well as large caps is a positive for stocks). Stocks consolidated this week. That’s fine for now.
Gold Signal OFF (GLD is above the “Trigger line” which is positive for gold, not stocks). Gold is linked to rates though, so follow the 10 Year yield with me.
Rate Signal ON (10 Year Yield above the “Trigger Line,” good for stocks, not bonds). The fall I predicted last week may not quite be done yet. (details above in part “4.”) Going below the orange Trigger Line will hit stocks in my view if rates get that far.
Thank you for reading. Would you please leave your comments below where it says “Leave a Reply”… or ask a question… Pay it forward too by sending the link to MarketTiming.Blog to a relative or friend. Thank you.
Note: My monthly newsletter is now CLOSED to new subscriptions until late this year. I’ll let you know here if and when it reopens.
Be sure to visit the website for more general investing knowledge at:
Standard Disclaimer: It’s your money and your decision as to how to invest it.
I thank Worden Brothers for the charting system I use to post these charts. If you want to know more about the charting system I use every day, go to my “Other Resources” page here: Other Resources It makes it much easier to follow along with me if you can see the charts and manipulate them on your own computer. It’s a great investment to have an excellent charting system. Check it out with a free trial at the link above.
Copyright © 2017 By Wall Street Sun and Storm Report, LLC All rights reserved.

Excellent analysis of market technicals! Always helpful for me and the investment decisions I make. The market timing signals are very useful and I appreciate your work!
Thank you,
Charles
Sorry for the delay in answering! I must have missed the email notification. I appreciate the feedback and your presence here over what is years now. You have proved repeatedly that applying market timing signals works in practice, not just in theory.