A Market Timing Report based on the 10-20-2017 Close, published Sunday, October 22nd, 2017
I deliver focused comments on market timing once or twice a week. These are supplemented with daily “Tweets/StockTwits” (see links below).
1. SP500 Index: The market went to all time highs this week based on progress with tax reform by the GOP. A brand new high is irrefutable strength in market timing terms, and the great news is that individual investors are still holding back. The GOP almost certainly will pass a bill, as they have the votes, but how much of a deficit they will build into it is up for grabs, given the fact that the House passed a revenue neutral bill, and the Trump Senate bill adds 1.7 Trillion to the national debt over 10 years. I’ve commented on the LACK of fiscal discipline by the GOP AND the Dems HERE.
Skip this paragraph if you don’t like historical economic truth. ; ) Our recent Presidents have mostly been fiscal liars with two exceptions. Bush Senior broke his word and raised taxes, because he wasn’t a fiscal liar. And Clinton balanced the budget if you don’t count the Social Security hedge, a hedge all the Presidents and Congresses use to fudge the numbers. So they were not ALL liars. Carter did not lie, but was very ineffective as a President at a time of crushing inflation. “Tinkle down economics” does not work. Reagan proved that with great help from the Dems who spent along with him. Yes, he sought a line item veto, which is like asking for Electoral College reform. It will never happen. But Reagan was a BIG spender in the end. I’d just like people to realize that the Reagan story has been idolized beyond reality. Reagan was a great man for bringing down the Soviet Union in my view, but not for having any true fiscal discipline.
The big, big news this week will be Friday’s GDP number. Consensus for the headline Q/Q number is 2.5% (@Bloomberg). It is specifically the first estimate of the third quarter Real (meaning inflation adjusted) seasonally adjusted annualized rate (SAAR) of growth, representing the quarter over quarter growth rate, projected from the third quarter forward. As you can imagine, it is hard to estimate growth for an entire year based on the rate of growth in one quarter, which is why the headline number fluctuates far more than the annualized or “Year over Year” GDP number. That’s why we’ll be looking at both the quarterly rate and the annualized rate when they come out. The Real SAAR GDP itself is a growth rate. Total GDP is a number estimating the production of the entire economy.
If Trump Growth is real, we should see the annualized rate tick up some more on this chart: HERE.
The markets would NOT respond well to a weak GDP number and will continue to rally based on a solid number, which would be 2.4% annualized in my view. Slow and steady keeps the Federal Reserve’s foot off the rate hike accelerator switch. Markets won’t mind slowly rising rates, and the financials will benefit from them as I discussed HERE.
How is the Canary doing? Read at the last link (just above) to catch up. Let’s look…

The Canary is Singing “The Green Song”: Bank of America is gaining on the SP500 Index.
The Canary is singing the “Green Song.” It is gaining on the SP500 Index (bottom part of the above chart, and it’s also gaining on XLF (not plotted) as I said it would. I’d like to see a breakout in that bottom part of the chart this week or next.
This leg of the market, if it is to be substantial, depends on rising interest rates. There is no excuse for anything else at this point. The Federal Reserve is cutting back on some of their prior massive interference with normal market mechanisms, which were undertaken for better (higher housing and stock prices) or worse (the bust to come could be bigger than the last one). That is why we’ll continue to BE IN this market, but be vigilant in watching for the cracks.
Warning: There may be a tendency during the current rally to become complacent as we saw in housing at the end of the last bubble. Don’t. Come back here and read and examine the charts for yourself every week even if there are no financial fireworks to disturb things.
There is one slight negative in the charts this week…see the small cap chart below…
Keep up-to-date during the week at Twitter and StockTwits (links below), where a combined 31,434 people are joining in…
Twitter® Follow Me on Twitter®. Follow Me on StockTwits®.
SP500 Large Cap Index (click chart to enlarge; SPX, SPY):
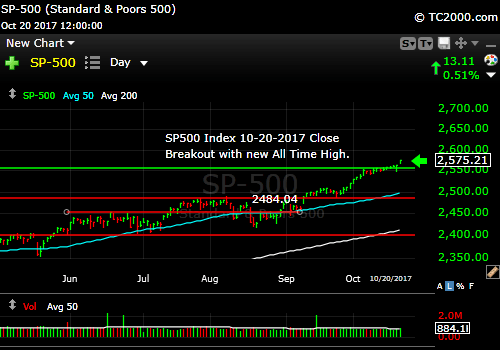
New high on Tax Reform progress.
Survey Says! Sentiment of individual investors (AAII.com) showed a Bull minus Bear percentage spread of +10.00% vs. +12.90% last week. With individual investors LESS Bullish at all time highs in the SP500 Index, we have more rally left. Yes, there can be pullbacks due to exogenous events (slowing elsewhere, geopolitics etc), but with earnings very strong this season and the economy growing at a reasonable pace (to be verified by the number out this next Fri.), the market should continue to do well.
| Thurs. 12 am close to poll | Bulls 37.93% | Neutrals 34.14% | Bears 27.93% |
2. U.S. Small Caps: I said last week: “The 10-09-2017 low is likely the base of the current U.S. small cap consolidation in market timing terms.” We tested below that market timing level during the week, but gains on Friday brought us back above that level.
What about the mid caps? They broke out to new highs this week (IJH). Check!
But now we need a breakout in the small caps to match that in the large and mid caps. No check mark there yet. It could come this week IF rates keep rising. So follow the interest rate chart (section #4 below).
Russell 2000 U.S. Small Cap Index (click chart to enlarge; IWM, RUT):

Small caps need a NEW breakout now.
3. Gold: The trade broke down on Monday with a “Bearish Engulfing Day” market timing signal, and rates climbed back up. The move was a “fakeout.” Expect more losses for gold in the coming months. The only thing that could save gold is inflation rising more rapidly ahead of Fed action (review last week’s comments HERE).
Gold ETF (click chart to enlarge the chart; GLD):
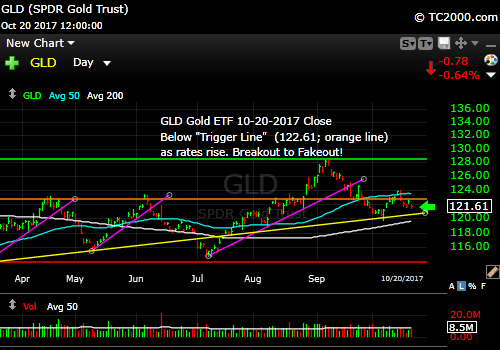
Gold will suffer from rising rates for months IF the economy is on track.
4. U.S. 10 Year Treasury Note Yield (TNX): My central thesis, as said, is rates must rise from here, or the recovery will be in trouble. Maybe the market can churn around for a while as Congress gets its act together, and rates can stumble sideways, but a correction of significant proportions would be much more likely in the case of falling rates.
Short term, stocks will hesitate if the 10 Year Yield in the chart below does not complete a market timing breakout above the aqua line.
Now, as usual, we need to review our three market timing signals (below the chart after you review it…)
U.S. 10 Year Treasury Note Yield (click chart to enlarge; TNX, IEF, TYX,TLT,TBF):

Rates rise again.
Let’s review the three market timing signals together….
MY SIGNAL SUMMARY for a Further U.S. Stock Market Rally:
Stock Signal ON (Small Caps above “Trigger Line”; a broad rally including small and mid cap stocks as well as large caps is a positive for stocks). BUT we need a small cap breakout this week or next.
Gold Signal ON (GLD is below the “Trigger line” which is negative for gold, positive for stocks).
Rate Signal ON (10 Year Yield above the “Trigger Line,” good for stocks, not bonds). We need a new breakout or at least stability in a higher range. The stock market rally will be muted if we don’t need new highs over weeks to months.
Thank you for reading. Would you please leave your comments below where it says “Leave a Reply”… or ask a question… Pay it forward too by sending the link to MarketTiming.Blog to a relative or friend. Thank you.
Note: My monthly newsletter is now CLOSED to new subscriptions until late this year. I’ll let you know here if and when it reopens.
Be sure to visit the website for more general investing knowledge at:
Standard Disclaimer: It’s your money and your decision as to how to invest it.
I thank Worden Brothers for the charting system I use to post these charts. If you want to know more about the charting system I use every day, go to my “Other Resources” page here: Other Resources It makes it much easier to follow along with me if you can see the charts and manipulate them on your own computer. It’s a great investment to have an excellent charting system. Check it out with a free trial at the link above.
Copyright © 2017 By Wall Street Sun and Storm Report, LLC All rights reserved.
