A Market Timing Report based on the 10-27-2017 Close, published Sunday, October 29th, 2017
I deliver focused comments on market timing once or twice a week. These are supplemented with daily “Tweets/StockTwits” (see links below).
Update 11-02-2017 9:21 am: Bitcoin Update – The price has skyrocketed over the past day or so, but has not quite reached the upper end of the market timing channel, which is at about 7490. This channel drawn on this chart is again ignoring the May swoon. If you buy here, be prepared to buy both higher and lower. Demand should continue to build prior to the mid-November Segwit2x fork.

Bitcoin running up near but not at trend line.
Update 11-01-2017 6:10 am: Bitcoin Update – If you include the 1100 low in the daily market timing chart, there is an upward wedge which is normally Bearish, but if you factor that out as an extreme event, it looks very much like an upward channel, nearing it’s upper end, yes, but with room to rise overhead to about 7070ish.

Room to rise to top of channel.
Update 10-31-2017 1:14 pm: Bitcoin Update – It’s sitting on some support here, but obviously has run up quite a “bit” today. There is room to fall to the next level of support at the earlier lows you see. The market is moving so fast, this chart could have changed quickly since I typed these words. It actually tested the lower level of market timing support at Bittrex and popped back up to that black line in a couple of minutes. Now it’s moving up again above that dark line. Lots of buyers entering still.
If you are interested in learning more about this market, please send me a message through the contact box HERE. I would like to gauge the interest in a “starter course” for buying cryptocurrencies.

Bitcoin Intraday Market Timing Chart
Update 10-30-2017: Japan is a Buy
I’m adding Japanese exposure based on the market timing breakout in their markets (see the Nikkei for example, now above 2015 high). I am doing it through the small cap route vs. the large, both of which should still benefit.
I’m also going with the dollar hedged ETF DXJS, because Japan is likely to lag in the tightening of their monetary policy vs. the US. If you are not sure about the currency issue, you could hold equal amounts of DXJS (WisdomTree Japanese Small Cap Dollar Hedged) and DFJ (Wisdomtree Japanese Small Cap Dividend Fund). They don’t have the exact same performance, but this is as close as we can get using ETFs from what I’ve found.
NOTE: The volumes of the small cap ETFs are very low, so be a little patient getting in, and check the premium you are paying at Morningstar.com. At least you know how much you are paying up (or down). DXJS has the best volume of the group and has had the best performance of the three. DXJS is in yellow below, DFJ in green, and DXJ in aqua, plotted against the Nikkei.
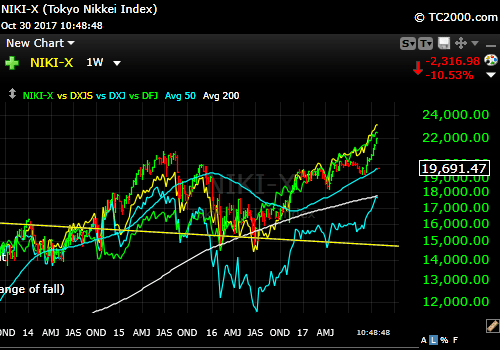
Nikkei vs. DXJS, DFJ, and DXJ.
If you want large cap exposure and dollar hedging, you can get that with DXJ or mix that with EWJ if you want to neutralize the currency issue. You could also mix large with small cap exposure.
Remember, I’m making two market timing decisions here:
1. The Japanese Economy will do well
2. The US dollar will beat the yen in the intermediate term.
I am focusing on the small caps, because over time the returns are greater in them, just as they are in the U.S. Of course the risk is higher in draw-downs.
Multiple sources are now onto this idea including the usually Bearish David Rosenberg who said Japan was the “most under-owned market: HERE.
Remember, don’t chase the ETFs (small caps in particular) or they’ll just fall right back down to their net asset value trading price (always check the NAV premium, whatever ETF you are buying!). Be a little patient if you want to buy and you’ll be happier.
Back to this week’s issue….
1. SP500 Index: U.S. GDP was better than expected by virtually all economists, beating the 2.5% SAAR GDP consensus @Bloomberg by about 0.5% at 2.95%, which was rounded to 3.0%. The Bureau of Economic Analysis (BEA that puts together the GDP report) said storm reductions and storm increases in GDP were likely, but it had no way to sort it all out through it’s current data collection methods.
The market was at first hesitant after the news and then rallied further. This also followed strong earnings performances and revenue growth by Amazon, Microsoft, Intel, and Alphabet, which all rallied in a panic mode. Some of that no doubt was short covering, but many were chasing the stocks.
I’d advise you to keep your “non-buyer’s remorse” in check and instead find other great investments with better value in current up trends. I am NOT talking about buying value stocks without growth! Buying value and waiting around can take a long time and value is out of favor at the moment. That will change, but until it does, why fight the trend? Foreign markets are some that are much cheaper than ours, and I’ve highlighted those before on my social media stream.
I’m up about 44% on KWEB purchases of Chinese internet companies I made in late Nov. 2016 (after prior profits were taken, so the gains are actually higher), and through additions in Jan. and April 2017. I took some profits during the recent decline, but I’m still holding 80% of the total position I had. The Chinese companies are providing the same services in China, but were cheaper. That is not as true today with some components like JD.com trading at valuations far above Amazon’s. Tencent is also a bit rich in valuation now.
KWEB survived at a key support level on Friday. We’ll see where it goes from here. I don’t just look blindly at support levels, so bouncing off of support by a little is not enough. I use my own proprietary methods of examining whether the bottom looks solid or not. This one is mixed. There is some positive divergence showing up, but there were not enough buyers to verify the low. It could be a decent entry point, IF it moves up tomorrow AND you are willing to sell if it breaks lower. If you are not, stay out. You will have to be more disciplined than ever to make money over the next two years.
There WILL be 5-10% corrections in this stock market rally, and we’ll need some cash to re-enter at better prices, meaning lower in relative but not necessarily in absolute terms. Big moves up followed by corrections that are smaller will occur several more times before this already old Bull collapses into a Bear market. That means higher lows and higher highs thereafter.
One possible, yet unknowable outside event? The Mueller Investigation is issuing its first indictments on Monday. I am calling it “Mueller Monday.” If the implications are not good for Trump, his plans come into jeopardy, and the markets will not like it. If he is NOT involved, that of course could have the opposite effect. This is a hard thing to handicap unless you buy puts with the idea you are paying for insurance and expect you will likely lose. I choose not to do this, but it’s not completely crazy.
Keep up-to-date during the week at Twitter and StockTwits (links below), where a combined 31,629 people are joining in…
Twitter® Follow Me on Twitter®. Follow Me on StockTwits®.
SP500 Large Cap Index (click chart to enlarge; SPX, SPY):
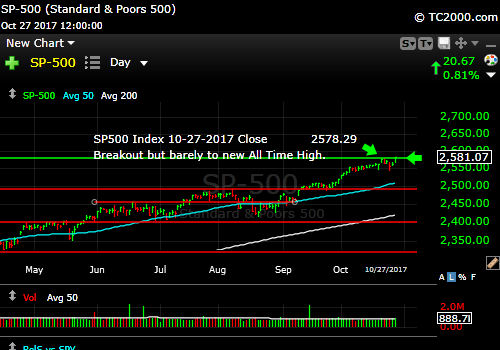
New high but barely. Take a look at the small cap chart.
Survey Says! Sentiment of individual investors (AAII.com) showed a Bull minus Bear percentage spread of +6.61% vs. +10.00% last week. I say there is still more rally left with these numbers (despite any short term pullbacks). With an all time high this week in the SP500 Index, the percent of Bears went up by just over 5 points just 2 days earlier (when the poll closed)! That is the opposite of what we’ll see when this market turns into a Bear.
| Thurs. 12 am close to poll | Bulls 39.64% | Neutrals 27.33% | Bears 33.03% |
2. U.S. Small Caps: Small caps did OK on Friday as they did the prior Friday, but they have yet to confirm the new high in the SP500 Index. Yet that was the same last week, and the large caps did very well despite it.
What about the mid caps? They AGAIN broke out to a new high (IJH).
Is the small cap performance still OK? Yes, actually, as it’s up more than the mid and large cap stocks since the November 2016 lows, but I’ll be keeping an eye on the index. They still need to break out eventually or the mid and large cap stocks will fall.
Russell 2000 U.S. Small Cap Index (click chart to enlarge; IWM, RUT):

Small caps looking for another breakout.
3. Gold: Gold still looks poor, unless something unexpected like a Trump impeachment pops up to surprise the markets. The Fed is clearly going to tighten. Gov. Powell is likely Trump’s Federal Reserve Chair pick who is closer to Dr. Yellen in his interest rate outlook than the far more hawkish John Taylor, who could easily foist his “Taylor Rule” (right or wrong) on the Fed. Still, Powell will continue to slowly raise rates and work off the balance sheet as Yellen has done, and the market likes that better than something more drastic, which they would get from both a Taylor or a Warsh, who is even more extreme than Taylor.
Gold ETF (click chart to enlarge the chart; GLD):

Gold suffers in rising rate environment with low inflation.
4. U.S. 10 Year Treasury Note Yield (TNX): Last week I said “short term, stocks will hesitate if the 10 Year Yield in the chart below does not complete a market timing breakout above the aqua line.” In fact, we made it above that line, and I believe rates will continue to rise. Stay with the financials in the meantime (read the issues from the past two weeks to see where I’m investing; links to upper right).
I cannot predict every squiggle in the chart, but over the next 6 months, rates will move higher. That’s my view.
Invest in shorter maturity bonds/Treasuries/CDs and keeping adding at longer maturities as rates rise. And get out of bond funds and invest in individual bonds, Treasury, and CDs if you can.
IF rates undulate in a range between 3.0% at the high end and 2.1% at the low end, bond funds can still do OK. If they move still higher though, bond funds will generate losses and drive even more assets into stocks.
And stay connected on social media (links above) on Monday. I’ll be adding exposure to a market with remaining growth potential IMO, depending on the state of the markets at the time. If things are not right, I won’t make this recommendation. This will be information I signal is posted here on the blog, via a social media comment. Don’t put all your money in it, but consider starting a position and add to it as it starts working in your account. You will have to be able to purchase ETFs to participate in this in the best way, although there is a “2nd level” way to participate too. Be sure to check out the data on this idea yourself before investing. As you know, I believe in conscious investing.
Now, as usual, we need to review our three market timing signals (below the chart after you review it…)
U.S. 10 Year Treasury Note Yield (click chart to enlarge; TNX, IEF, TYX,TLT,TBF):
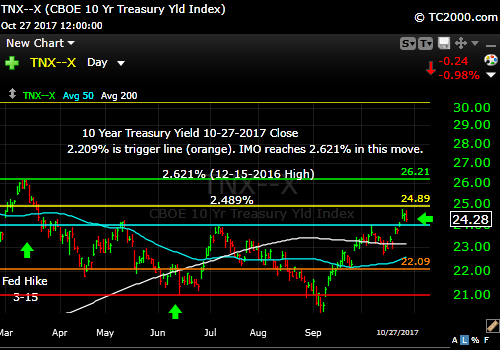
Rates still rising as expected in a strong economy.
Let’s review the three market timing signals together….
MY SIGNAL SUMMARY for a Further U.S. Stock Market Rally:
Stock Signal ON (Small Caps above “Trigger Line”; a broad rally including small and mid cap stocks as well as large caps is a positive for stocks). BUT we need a small cap breakout still.
Gold Signal ON (GLD is below the “Trigger line” which is negative for gold, positive for stocks).
Rate Signal ON (10 Year Yield above the “Trigger Line,” good for stocks, not bonds). The stock market rally will be muted if we don’t need new highs over weeks to months.
Thank you for reading. Would you please leave your comments below where it says “Leave a Reply”… or ask a question… Pay it forward too by sending the link to MarketTiming.Blog to a relative or friend. Thank you.
Note: My monthly newsletter is now CLOSED to new subscriptions until late this year. I’ll let you know here if and when it reopens.
Be sure to visit the website for more general investing knowledge at:
Standard Disclaimer: It’s your money and your decision as to how to invest it.
I thank Worden Brothers for the charting system I use to post these charts. If you want to know more about the charting system I use every day, go to my “Other Resources” page here: Other Resources It makes it much easier to follow along with me if you can see the charts and manipulate them on your own computer. It’s a great investment to have an excellent charting system. Check it out with a free trial at the link above.
Copyright © 2017 By Wall Street Sun and Storm Report, LLC All rights reserved.
