A Market Timing Report based on the 12-01-2017 Close, published Saturday, December 2nd, 2017
I deliver focused comments on market timing once or twice a week. These are supplemented with daily “Tweets/StockTwits” (see links below).
12-03-2017 Bitcoin Update: How High Should it Be? It Depends….
The “Utility” of the coin is the real underlying driver and the size of the network per Metcalfe’s Law is part of that utility, but chart-wise, the answer depends on how you draw the market timing channel from the base. If you go all the way back to the start of the 2017 incline (and use a log plot as should be done), we’re only about mid-channel (slightly below there in fact, as current price is 11,310 at 10:53 pm ETC on Sunday at Bittrex which tends to be a bit low compared to other sites like Coinbase and Gemini).

Bitcoin charted from the 2017 incline.
Now back to this week’s action packed issue…well, it was an exciting week in many ways!
1. SP500 Index: A Big Swoon hit the stock markets Friday requiring rapid market timing reactions with both the Senate Tax Reform Bill in play as well as the revelation of a Michael Flynn plea bargain in which he admitted lying to the FBI. Since our dear President is not always to be believed (ask the business people he swindled; I interviewed one and spoke to a source about a second incident; many others have been fully reported), we cannot know if Trump’s comment is true, that what Flynn did was legal, though his lying was illegal.
This means there is an non-measurable risk to the markets, which only tells us not to overdo it until the air clears. What that is to you, you must decide on your own exposure levels to the stock markets of the world. I am still overexposed to the markets vs. my usual maximum exposure as I call it and you can read my latest exposure summary at either of the social media links immediately below.
I added back some Facebook exposure after it fell to around 174 on Weds. and sold it for a gain of 0.83% in a day, and then re-entered at 174.56 (also added very short term Treasury exposure, which beats the bank, and brought down cash level, and sold some China exposure taking profits on the recent re-buys). The Facebook close was still up from my buy by a fraction at 175.00, but down 1.17% for the day. I would have added more exposure elsewhere had the deepest dive lasted for more than 2 minutes. Dip buyers were very active off the low. There was about a 37% recovery of “swoon losses” within 4 minutes, although there was a slight pullback after that which lasted all of 7 minutes.
The market bounced once the tax bill passing was assured by various holdout Senators and we are back to a “Stretched” status. The market timing signals are the “Stretch Marks” as I called them this week. They signal “don’t buy” until the next pullback. I will be pulling the trigger when it’s appropriate based on a relief of the current market stretch above the upper yellow channel line seen in the chart below.
Keep up-to-date during the week at Twitter and StockTwits (links below), where a combined 32,720 people are joining in…
Twitter® Follow Me on Twitter®. Follow Me on StockTwits®.
SP500 Large Cap Index (click chart to enlarge; SPX, SPY):

SP500 Index stretched above the channel still.
Survey Says! Sentiment of individual investors (AAII.com) showed a Bull minus Bear percentage spread of +4.33% vs. +6.48% vs. last week. It barely moved despite the markets reaching all time highs. Plenty of room to go, but as I said above, due to the stretch right now, further consolidation (a sideways move) may be required at a minimum, if not more backtesting.
| Thurs. 12 am close to poll | Bulls 35.95% | Neutrals 32.43% | Bears 31.62% |
2. U.S. Small Caps: If you don’t think there are dip buyers, take a look at the Russell 2000 market timing record this week! The recovery from the swoon was breathtakingly fast – note the BIG RED LINE for Friday’s price range in the chart. IWM still closed -0.41% for the day, but was little changed compared to the earlier damage from the Flynn plea bargain. The small caps will inherently carry more risk (beta) in a pullback if we see one, but they are not particularly stretched on a longer term time frame. Still, it’s best to buy pullbacks like Friday’s, even if the future drops are less generous.
Russell 2000 U.S. Small Cap Index (click chart to enlarge; IWM, RUT):

The bounce back was fierce.
3. Gold: Gold is following interest rates even more than the US dollar over the short term here. My market timing trigger is still in play as we’re close to that orange line. Gold is going to show its hand soon, so trade in the direction of the move. The Bullish view is based on TrumpFlation; the Bearish view is based on economic growth with low inflation.
Gold ETF (click chart to enlarge the chart; GLD):
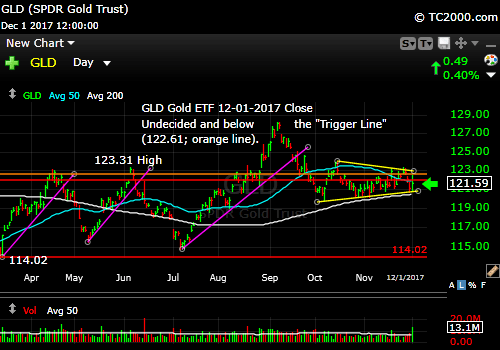
Gold in holding pattern. Trade the direction of the move.
4. U.S. 10 Year Treasury Note Yield (TNX): I said last week: “I’m watching the 2.304% market timing level and do not want to see the 10 Year Yield fall below there.” The swoon of stock selling/Treasury buying took the yield back to 2.315% but the close was 2.362%. I see higher rates coming as TrumpFlation is all but certain due to wage pressures, and the tax plan will be somewhat stimulative to GDP.
I am an independent as many of you know. That does not prevent me from seeing the impact of the GOP Tax Plan. The Tax Policy Center says the Trump/GOP Plan will create 0.7% more GDP growth in 2018 and fall from there. Employment is “full,” and the issue is not the number of jobs as I’ve said here before; it’s that those looking for jobs lack the necessary training to fill the vacancies.
#TaxScamBill Who gets screwed by the Tax Bill? The biggest tax increases by 2025 (this is considered the best true sample year, before the expiration of any of the individual tax cuts) will be seen for about 20-25% of those making between $91,700 -$308,900 per year. Only 4.4-6.9% of those making less than $53,900 will have an average tax increase of $400-810. I am guessing that the biggest losers are mostly concentrated in the states with high state and local property taxes due to the limitation on those deductions to $10,000. Review the details in the 2025 Chart HERE.
Remember when reading the press on the Tax Bill that if you look at the numbers AFTER the individual cuts go away, the results are very different and very bad. It’s not the intent of the GOP to not deal with this later.
Here are my 2018 and 2020 predictions: Since 74.1% of US families will get a tax cut, the negative reaction seen now may dissipate when the actual results are seen by this super-majority. Those hurt the most other than the upper middle class will be the poor who lose Medicaid coverage, but they don’t vote as much as wealthier people do. The other group hurt will be in states Trump LOST in the 2016 election, so it won’t impact him in 2020. In fact, he may do better if the Flynn thing does not blow up in his face (completely unknown at this point regardless of what anyone says; only Mueller knows what he’s really got).
But here’s the rub for Trump and it will cost him countless tweeting hours: the GOP will lose enough seats in the 2018 elections to cause the Democrats to take over the Senate and/or the House. It only takes three Dems to shift the balance of power in the Senate because they have 48 seats and Pence is the tie breaker for 50:50 ties. Trump will be entirely dependent on Democrats to get anything else done following the 2018 elections. Obama had the same problem of gridlock.
Whether Trump wins or loses in 2020 will depend on the state of the economy and healthcare, which are the two top priorities of voters, and on the energy of the Democratic Party. The occurrence or non-occurrence of a major US terror event may also play some role, but unless BIG, it will be secondary. It will be much harder for Trump to win with his current lean 30% base. The Tax Cuts are not big enough to change enough votes by themselves, and the Democrats will be fiercely energized in their hatred of him. They will work much, much harder than Hillary, who tried to coast to a win, while Trump kept plugging day after day after day. Persistence pays dividends, even for sex scandal stained candidates like Trump.
U.S. 10 Year Treasury Note Yield (click chart to enlarge; TNX, IEF, TYX,TLT,TBF):

Treasuries still moving in a range.
Now, as usual, we need to review our three market timing signals (below the chart after you review it…)
Let’s review the three market timing signals together….
MY SIGNAL SUMMARY for a Further U.S. Stock Market Rally:
Stock Signal ON (Small Caps above “Trigger Line”). I expect further upside.
Gold Signal ON (GLD is slightly below the “Trigger line” which is negative for gold, and better for stocks. My reasons are above, but remember to trade the direction of the next move, if you are a trader. Investors should consider gold “currency insurance” and consider some bitcoin as an additional small % hedge perhaps. Know that bitcoin could go to zero, just as stocks can. Gold can also experience huge drawdowns.
Rate Signal ON (10 Year Yield above the “Trigger Line,” good for stocks, not bonds). I’ve set my line in the sand for a pullback that is healthy. See above.
Thank you for reading. Would you please leave your comments below where it says “Leave a Reply”… or ask a question… Pay it forward too by sending the link to MarketTiming.Blog (that link will immediately connect them to this webpage) to a relative or friend. Thanks for doing that.
Note: My monthly newsletter is now CLOSED to new subscriptions until late this year. I’ll let you know here if and when it reopens.
Be sure to visit the website for more general investing knowledge at:
Standard Disclaimer: It’s your money and your decision as to how to invest it.
I thank Worden Brothers for the charting system I use to post these charts. If you want to know more about the charting system I use every day, go to my “Other Resources” page here: Other Resources It makes it much easier to follow along with me if you can see the charts and manipulate them on your own computer. It’s a great investment to have an excellent charting system. Check it out with a free trial at the link above.
Copyright © 2017 By Wall Street Sun and Storm Report, LLC All rights reserved.
