A Market Timing Report based on the 12-01-2017 Close, published Saturday, December 2nd, 2017
I deliver focused comments on market timing once or twice a week. These are supplemented with daily “Tweets/StockTwits” (see links below).
1. SP500 Index: Did you buy this week rather than sell at the lows? I hope you did, and I’ll go over the progress made in these positions in a moment.
But first, a bird’s-eye view. Looking at the S&P500 Chart, classically, one would say it is overbought as it’s trading above that upper channel in market timing terms. However, there could have been somewhat of a reset higher due to the passage of tax reform, which was previously not assumed though hoped for. I’ll say this: the market will be healthier if it consolidates (goes sideways) for a bit before heading higher. I cannot say it will do so, as sentiment is still too neutral (see stats below).
The tax boon to companies will be big for 2018 if the Tax Reform Bill passes and adds measurably to earnings to the tune of 10%, but this varies for each company (there are some losers, so check your stocks out!). We had to do some market timing around tech last week, which is so far still in the green. If you look at the SP500 Index chart below, it bounced back up to a new closing high and even the QQQ was nicely off its lows (I also bought that near the bottom as noted on social media this past week, along with Facebook; one other buy is also noted).
The big or not so big deal this week will be the Federal Reserve meeting. The 0.25% rate hike to a range of 1.25-1.50% is expected by nearly everyone per the CME Group with 9.8% expecting a 0.50% hike, which would be taken badly, because it’s so unexpected. The number of hikes they predict for the coming year will be the juice of the meeting though. The Federal Reserve has the chance to mess things up in this recovery by raising rates too quickly ahead of the world’s economic growth. It could even bring us into recession as that has happened before. If they become marginally more dovish instead of hawkish, the market may question the strength of the economy, and hence the valuation of the stock market. For this reason, watch carefully for which way they slant things.
What will the degree of Federal Reserve hawkishness/dovishness do to the markets in a bit more detail? “Mildly hawkish” would mean slowly rising rates, and would be well received, particularly by the financials, because that is their current stance. “Very hawkish” would be totally out of step with slowing in regions like Europe and even China and would be Bearish for stocks in general, bonds, and initially gold, as it could eventually lead to a Fed induced recession. It also could mess with the Christmas buying season and 2017 GDP for the Fed to become more hawkish in mid-December. “Marginally more dovish” would hurt the dollar and financials, while helping emerging markets , US tech, and to a lesser extent gold, because it would mean the economy will be growing with low inflation, which hurts gold, because it’s a non-productive asset. Lower rates on their own would be marginally helpful to gold, however. There is no case to be made for “Very dovish” at this point in the recovery.
My prediction? Steady as she goes, meaning “mildly hawkish.” Anything else will cause upset in opposing directions to current trends. The Fed remaining “Mildly Hawkish” this week would allow the current trends to persist at least for the short term. Chair Yellen is out at the beginning of February to be replaced by Jerome Powell, and this is her last news conference, and she does not want or need to create trouble on the way out. Softness in the world economy may cause the Federal Reserve to at least dampen expectations for further rapid rate hikes, so we’ll have to follow this carefully.
Keep up-to-date during the week at Twitter and StockTwits (links below), where a combined 32,957 people are joining in…
Twitter® Follow Me on Twitter®. Follow Me on StockTwits®.
SP500 Large Cap Index (click chart to enlarge; SPX, SPY):
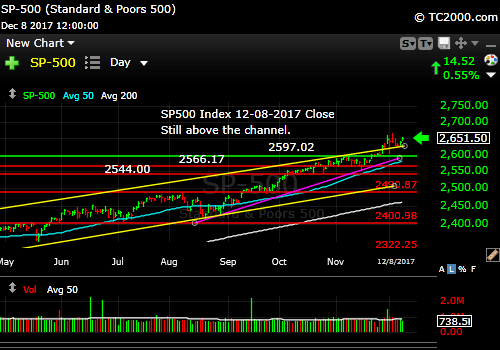
SP500 Index bounces back to a new all time closing high.
Survey Says! Sentiment of individual investors (AAII.com) showed a Bull minus Bear percentage spread of +2.66% vs. +4.33% last week. Sentiment is clearly not in the way of this market going up or down frankly, but as we are at an all time closing S&P500 Index high with lagging sentiment, I remain long and Bullish. I have a bit more cash as my reports on social media show (see links above), because I’ve taken off exposure in China as mentioned there. I’ve replaced some of that with US exposure.
| Thurs. 12 am close to poll | Bulls 36.88% | Neutrals 28.90% | Bears 34.22% |
2. U.S. Small Caps: Speaking of market timing in action, I did use it to buy the dip as they say, but perhaps could have added more. Small caps are holding the prior breakout. If that goes away with the Fed or other news, we’ll be retesting the 144.25 area at least. I am not betting on that happening, but they need to make progress this next week and have a good response to the Fed’s comments. The financial component of the Russell 2000 won’t want anything less than “Mildly Hawkish” as explained above.
Russell 2000 U.S. Small Cap Index (click chart to enlarge; IWM, RUT):
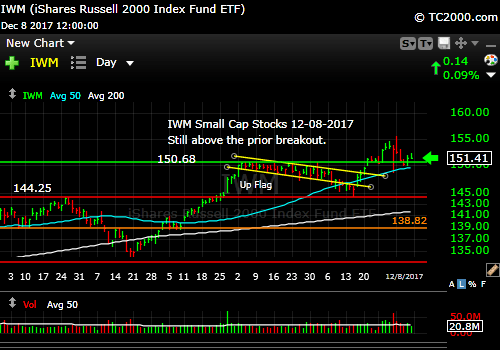
Small caps are back up from their swoon.
3. Gold: Gold was hurt badly, s0 I hope you followed my market timing advice and were out of your gold trades with the first break of the yellow triangle. If you did, you saved yourself the next drop in gold prices. I expect continued economic growth under the Trump plan (like him or not), and that will hurt gold as I’ve explained for months now.
Gold ETF (click chart to enlarge the chart; GLD):

Gold hit hard as I predicted on the 1st break of the triangle.
4. U.S. 10 Year Treasury Note Yield (TNX): My market timing on rates last Sunday was accurate. Rates held the low I wrote about. I continue to look for buying points for short term bonds at this point, followed by longer term bond exposure in individual bonds as rates move higher. If the Federal Reserve manages to keep rates range bound below 3% or so, you’ll still do OK in bond funds, but try to avoid them if you can until economic growth starts to slow. Buy individual bonds at shorter durations and ladder them out in duration and yield as rates go higher.
Do you see the yellow triangle? Note that as gold cut through the base of its daily triangle, rates were moving up as I said they would last week. Any breach of the rate triangle to the downside will be taken as the Federal Reserve being more dovish, the consequences of which I’ve already explained above. Watch which way yields cut, up or down, because it’s going to have a BIG impact on the market, obviously particularly on anything directly rate sensitive like the financials.
U.S. 10 Year Treasury Note Yield (click chart to enlarge; TNX, IEF, TYX,TLT,TBF):
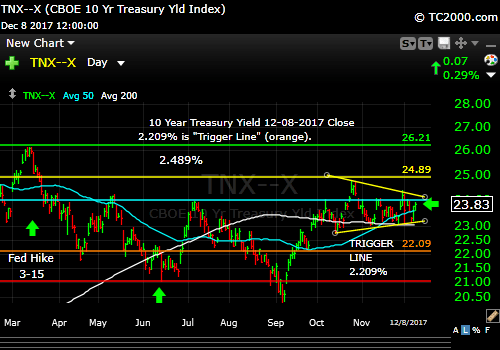
Rates are about to make an important directional decision.
Now, as usual, we need to review our three market timing signals (below the chart after you review it…)
Let’s review the three market timing signals together….
MY SIGNAL SUMMARY for a Further U.S. Stock Market Rally:
Stock Signal ON (Small Caps above “Trigger Line”). Staying long for now.
Gold Signal ON (GLD is below the “Trigger line” which is negative for gold, and better for stocks). Watch out below. Could fall to the lower support level shown.
Rate Signal ON (10 Year Yield above the “Trigger Line,” good for stocks, not bonds). Watch the yellow triangle this week!
Thank you for reading. Would you please leave your comments below where it says “Leave a Reply”… or ask a question… Pay it forward too by sending the link to MarketTiming.Blog (that link will immediately connect them to this webpage) to a relative or friend. Thanks for doing that.
Note: My monthly newsletter is now CLOSED to new subscriptions until late this year. I’ll let you know here if and when it reopens.
Be sure to visit the website for more general investing knowledge at:
Standard Disclaimer: It’s your money and your decision as to how to invest it.
I thank Worden Brothers for the charting system I use to post these charts. If you want to know more about the charting system I use every day, go to my “Other Resources” page here: Other Resources It makes it much easier to follow along with me if you can see the charts and manipulate them on your own computer. It’s a great investment to have an excellent charting system. Check it out with a free trial at the link above.
Copyright © 2017 By Wall Street Sun and Storm Report, LLC All rights reserved.
