A Market Timing Report based on the 12-15-2017 Close, published Sunday, December 17th, 2017
I deliver focused comments on market timing once or twice a week. These are supplemented with daily “Tweets/StockTwits” (see links below).
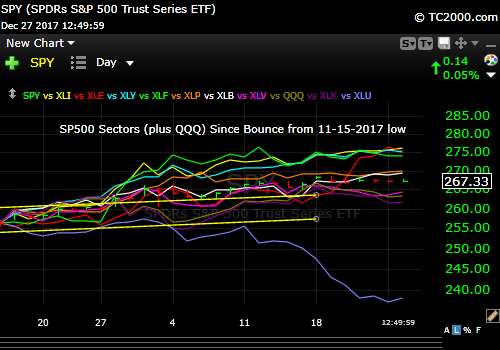
12-27-2017 Update: S&P500 Index Sector Market Timing Chart Update (with QQQ added), since the 11-15-2017 market timing low: XLU is the biggest loser. The order from top down is in order of the color key at the top of the chart shown below. XLI is at the top, running neck and neck with XLE, XLY, and XLF. Running a bit behind the SPY are XLK, QQQ, and XLV. Note the two long yellow lines represent the prior channel the SPY was respecting. We’re running above the channel still, implying either a Tax Plan reset or a stretched market, take your pick. It’s likely a bit of both.
Some say Tech will lead the Bull Market into 2018, but as pointed out, the earnings comparisons will be tough for tech coming into Q1 2018. Is the recent relative chart weakness a harbinger? The charts will answer this, but overloading on tech ahead of the tough earnings comparisons could backfire. If you buy into a “Tech 2018 leadership thesis,” be sure to buy low, not high.
I’ll have more by Jan 1st! But be sure to read the Tax Bill Trade set-up comments below…
Market Timing the S&P 500 Index Sectors
This is the issue from the mid-month close, but gives you the set-up for the Tax Bill Trade… (next issue out by Jan 1st)
1. SP500 Index: The Federal Reserve kept to the script I reviewed last weekend and remained “mildly hawkish.” They raised rates by the expected 0.25% and expect to raise rates a total of three times in 2018 as they thought they would before. No further hike is expected until March, which is handicapped at only 62.8% odds (for at least one hike then) per the CME numbers.
That stance resulted in my “Canary in the Trump Gold Mine” a.k.a. Bank of America (BAC) selling off a bit from its high this week with a positive but “inside day” on Friday (inside the range of the prior day; actually it hit the high end of the range and the low on Fri. was barely above the low of Thurs.). I sold BAC near the high in anticipation of a pullback, since the prior hikes this year and last were met by the same. This was also true for XLF, the SPX financials as I said, although the beta there is lower, so the potential gain by selling high and buying low lessens. Still, I sold both near the highs to generate a bit of outperformance of the market. That’s the market timing plan at least.
Depending on how interest rates behave, I may buy back some financial exposure this week. Sometimes the swings lower don’t allow for the room to make good trades around core positions. This may have been one of those times. My core positions are noted in the trading plan you’ll read a bit later in this post. The sector bets are trades around the core to augment returns.
I also dumped oil exposure in the form of XLE (SPX Energy ETF) at a slight profit. I expect oil to trade down from here as charted at the links below. I like slight profits better than bigger losses. Europe and China are slowing now, so oil could ease further than is thought by overly Bullish speculators.
Keep up-to-date during the week at Twitter and StockTwits (links below), where a combined 33,234 people are joining in…
Twitter® Follow Me on Twitter®. Follow Me on StockTwits®.
Review the SP500 Index chart and then we’ll look at the small caps.
SP500 Large Cap Index (click chart to enlarge; SPX, SPY):
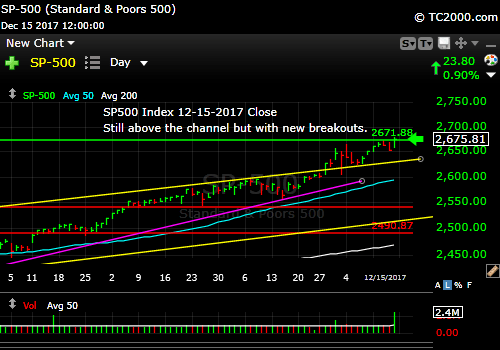
Huge fund flows push the index to a brand new high.
Survey Says! Sentiment of individual investors (AAII.com) showed a Bull minus Bear percentage spread of +16.87% from +2.66% vs. last week. Given the pattern of sentiment vs. trading since the 2016 election, I see up to a potential week of further upside at which point sentiment will be back to the low 20’s, but only if interest rates are stable to UP from here. IF interest rates move down on Monday, there could be some profit taking for several days, followed by a bit of a rally into Christmas weekend. Tax loss selling could hit between now and 12-31-17.
| Thurs. 12 am close to poll | Bulls 45.00% | Neutrals 26.88% | Bears 28.13% |
2. U.S. Small Caps: There is renewed interest in small caps after the Fed’s action to stay on course with their “mild hawkishness” with slowly rising rates. I am only 0.35% behind the small cap index from where I sold on 12-11 ahead of the Federal Reserve statement, as the gains seen on Friday were reduced into the close as interest rates softened. Their performance will be similarly tied in with interest rates on Monday. I’ll be watching for market timing entry points, as small caps should benefit from rising rates (esp. the financial component) and a rising US dollar. But IF the rate picture softens into Q1 with falling oil and commodity prices, small caps will not do well. That’s the risk. Falling rates would imply a slower economy and small caps are sensitive to growth, because without it, they fail to become mid caps!
One reason to be out of or less exposed to small caps at the moment is that they have been weak compared to large caps since 11-29. It has been 9 days since the last high was achieved vs. the new high on Friday for the S&P500 Index (SPX). This lag is also true of midcaps. The Bullish argument? Remember that if US growth continues as I expect it will even with slight slowing elsewhere in the world into Q1, then small and mid caps should catch up. Short term I expect rates to drive the small cap index (up or down; up on higher rates; down on lower), but longer term, growth will kick in and push them higher. This is the plan which I assess on a continuing basis.
Also beware of tax loss selling into the end of the year especially in small caps, but also in any other stock that has been beaten up this year.
Russell 2000 U.S. Small Cap Index (click chart to enlarge; IWM, RUT):

Healthy backdrop would include slowly rising rates and economic growth.
3. Gold: Rates moved down and gold moved up a bit after the Federal Reserve FOMC decision on Wednesday. The rate hike dance continues. Gold is only good as insurance against higher and higher national debt. Trump in his own words “loves debt,” so it’s not surprising he’s willing to add to it and further weaken our currency. I am an independent fiscal conservative who believes BOTH parties are irresponsible when it comes to debt. In the meantime, hold some gold and perhaps some cryptocurrency, if you are willing to spend the time to use market timing to buy the lows rather than chasing higher prices like most of the newbies.
Gold ETF (click chart to enlarge the chart; GLD):

Gold is not the place to be except as dollar insurance.
4. U.S. 10 Year Treasury Note Yield (TNX): I bought short term Treasuries yet again at the top of the “Rate Triangle” (in yellow on the chart below). My market timing was accurate. The resolution of this triangle is going to drive markets in predictable directions I’ve laid out this week and last.
U.S. 10 Year Treasury Note Yield (click chart to enlarge; TNX, IEF, TYX,TLT,TBF): (“Rate Triangle” in yellow…)
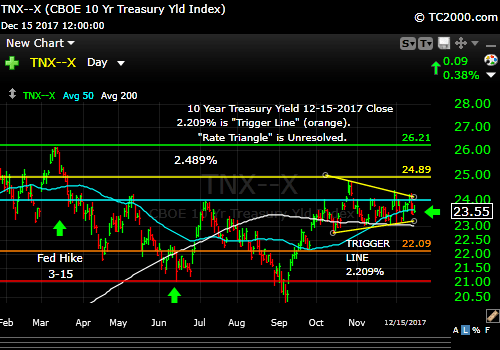
The “Rate Triangle” still Rules!
NOW for the “Tax Plan Playbook”
1. Get long Big Spenders as they get the greatest tax breaks as is always the case for GOP tax bills. I’ll be looking for market timing spots to add broad exposure to consumer discretionary stocks, just as I added to Disney (DIS) on that basis and on the basis of the revitalization of their business through the purchase of Fox assets. I used market timing technicals to enter and then add to my initial Disney position. Enter consumer discretionary stocks on pullbacks.
2. Stick with Large Caps in general: Money will continue to pour into large cap US stocks. That means the S&P500 Index, SPY or equivalents. Buy the lows! Do not chase the highs.
3. Big Tech with Growth: Repatriation will help big cap tech despite the argument that they already pay lower corporate tax rates. Proxies for big tech include QQQ, which gives you both a heavy 40%+ tech exposure in the case of QQQ as well as large cap exposure from #2 above. Another choice, the XLK ETF is all big tech as it represents the SP500 Tech stocks. Semiconductor stocks are another possible exposure to add on market timing pullbacks – like the current one incidentally. QQQ seems like a better match with #2 and #3 and it includes consumer discretionary exposure such as AMZN and more. Note also that QQQ closed at an ALL TIME HIGH this Friday along with SPY. Buy pullbacks.
4. “Other Caps”: Avoid US small caps and financials if rates soften and enter them if the the rate triangle resolves to the upside Small caps will do well as long as rates rise slowly and stay within a reasonable range, so as to not shut down economic growth, which the Federal Reserve has a knack for doing. I am going to suggest maintaining a core mid cap exposure as they perform best over long periods of time (e.g. IJH), but buy them on pullbacks to take advantage of volatility.
5. Stick to individual shorter term Treasuries/Bonds you can hold to maturity (and avoid bond funds for the next few years if possible), but it may be possible to trade a break of the rate triangle below the lower market timing trend line in the triangle. If rates crash, bonds rally.
6. Stay out of gold unless inflation picks up except as insurance against dollar weakness unless the “Rate Triangle” breaks to the downside.
7. etc. There are other pointers for foreign markets you will see only if you follow my messages on social media (links above). Have to save some gems for later!
Bookmark this page so you can refer back to this playbook. Let me know what you think by leaving your comments below…
Now, as usual, we need to review our three market timing signals (below the chart after you review it…)
Let’s review the three market timing signals together….
MY SIGNAL SUMMARY for a Further U.S. Stock Market Rally:
Stock Signal ON (Small Caps above “Trigger Line”). Staying long for now.
Gold Signal ON (GLD is below the “Trigger line” which is negative for gold, and better for stocks).
Rate Signal ON (10 Year Yield above the “Trigger Line,” good for stocks, not bonds). Watch the yellow triangle this week!
Thank you for reading. Would you please leave your comments below where it says “Leave a Reply”… or ask a question… Pay it forward too by sending the link to MarketTiming.Blog (that link will immediately connect them to this webpage) to a relative or friend. Thanks for doing that.
Note: My monthly newsletter is now CLOSED to new subscriptions until late this year. I’ll let you know here if and when it reopens.
Be sure to visit the website for more general investing knowledge at:
Standard Disclaimer: It’s your money and your decision as to how to invest it.
I thank Worden Brothers for the charting system I use to post these charts. If you want to know more about the charting system I use every day, go to my “Other Resources” page here: Other Resources It makes it much easier to follow along with me if you can see the charts and manipulate them on your own computer. It’s a great investment to have an excellent charting system. Check it out with a free trial at the link above.
Copyright © 2017 By Wall Street Sun and Storm Report, LLC All rights reserved.
