A Market Timing Report based on the 1-12-2018 Close, published Sunday, January 14th, 2018
I deliver focused comments on market timing once or twice a week. These are supplemented with daily “Tweets/StockTwits” (see links below).
Update 1-17-2018: Bitcoin Needs to Hold the Line
The most generous trend line I’m willing to draw is shown in the chart below. Bitcoin must hold this market timing trend line or else the damage increases dramatically beyond the already impressive drawdown off the high. Manage your risk accordingly. Remember however that a test below a line does not mean the break will hold. Sometimes it takes a few days to see if a certain level or line will hold the trend. If you are selling, you may want to sell in stages. If you are buying, buy in stages and exit if the level you bought at breaks.

Bitcoin must hold this trend line.
And now back to this week’s analysis of the markets…
1. SP500 Index Market Timing: We are at another brand new shiny high in the SP500 Index this week. This has created another breakout above the new prior HIGHER channel after the 11-30-2016 breakout. Part of this was a “reset” as I’ve called it due to the one time implications of repatriation AND lower tax rates. The question is whether the second higher reset will stick or not. Eventually markets will have priced in the higher earnings reality of the tax bill. This may take some time, and this means we cannot rule out even higher resets in the US stock market.
The reaction to the Big Bank earnings on Friday was positive, as the XLF financial component to the SP500 Index rose a market-beating 0.90% while SPY rose 0.65%. Bank of America (BAC) rose a big 1.73%, anticipating good results this coming Thursday when they report earnings.
The expected deceleration of earnings growth in tech that I’ve mentioned previously could provide some bumps, although growth in tech earnings will be continuing throughout the year. Yes, that means growth occurring at a decelerating rate through part of the year. The actual deceleration won’t come out until the April earnings reports of Q1 2018. What tech companies are about to say could change things. If weaker than expected currently, this could mean tech falters a bit while other sectors pick up the lead, including the financials, health/biotech, and energy (unless oil corrects from the current extended levels).
Won’t U.S. growth slow as China slows? There was a growing consensus that China was going to slow substantially in the “old China” sectors in 2018, and yet the A and H share ETFs have broken out to new recent highs. I remain invested in “New China” via KWEB mainly, but exited the A and H shares too early (for 18.75% and 15.43% profits w/o dividends, respectively). Although there was both technical weakness in those markets and fundamentals that confirmed a slowing, the markets now disagree, and so now my job is to re-enter on pullbacks. The risk was early re-entry on strength only to see the markets roll over once again. Yet the early cue offered was the initial technical recovery of the markets. The new definitive market timing signal on the Chinese markets are the breakouts which confirm, for now, the up trend is intact.
Chinese data is always looked at skeptically, and yet these numerous macro calls were made based on such data. The Chinese government says they’ll grow at about 6.5% for the year, far above U.S. growth, which is headed to lifting above 3%. China may be slowing marginally, but is still apparently growing. The macro China Bears are wrong for now, so says the ultimate arbiter, the market.
Keep up-to-date during the week at Twitter and StockTwits (links below), where a combined 33,300+ people are joining in…
Follow Me on Twitter®. Follow Me on StockTwits®.
SP500 Large Cap Index (click chart to enlarge; SPX, SPY):

Higher and higher channels.
Survey Says! Bullish sentiment fell somewhat this week as I expected, given the last extreme. Sentiment of individual investors (AAII.com) showed a Bull minus Bear percentage spread of +23.60% vs. +44.2% last week. Review last week’s data or you won’t be prepared for the next correction – see the data HERE. A correction is coming, and we’ll be watching for signs to “lighten up” a bit, so we can take advantage of the sell-off by buying low again.
| AAII.Com Individual Investor Sentiment Poll | ||
| Bulls | Neutrals | Bears |
| 48.67% | 26.25% | 25.07% |
| Thurs. 12 am CT close to poll | ||
2. U.S. Small Caps Market Timing: Small caps, as the next chart shows, have been leading since the 2016 Election low, despite the long pause over the 6 months from late 2016 to 2017. SPY is shown in yellow in the chart. You can see that buying the pullbacks of IWM toward the SP500 Index were fruitful. We will be looking for those entry points. My bigger exposure in my core portfolio to the small to mid range, as I’ve said, is IJH (midcaps). I have added exposure to IJH over several years and have not traded one share.
Russell 2000 U.S. Small Cap Index (click chart to enlarge; IWM, RUT): Longer term view…

Small caps keeping up.
Here is the chart of more recent price action. We are two days into another breakout. It often takes 2-3 new highs to confirm such a move.

New high, again…
3. Gold Market Timing: Gold is still lagging the SP500 Index since the 2016 Election, but it’s doing better than one would think in an economy that is growing with low inflation. This must mean that the market is anticipating greater inflation than is now being reported. Otherwise, holding gold in greater quantities does not make sense. TrumpFlation is on its way is what the gold market says to me.
Asset inflation alone does not mean higher gold prices as we saw with record low gold prices of 251.70 in late August 1999 preceding the tech crash of 2000. This tells me the markets are anticipating higher inflation.
This is what I call “TrumpFlation”: Fiscal stimulus in the form of tax cuts in an economy with low unemployment leading to inflation. The best you can say is that gold rising with stocks represents asset inflation, which invariably leads to a collapse of much greater magnitude than would otherwise occur. Bubbles pop! A non-bubble becomes a bubble with enough inflation as rates rise rapidly and bonds compete with stocks for better returns. Gold will work if inflation in fact increases significantly ahead of Federal Reserve action.
What about a deflationary “pop”? Unfortunately gold does not protect investors in the setting of a deflationary “pop.” It goes down with stocks as all assets are repriced as in the Great Recession.
An aside on oil (I chart oil at least once but often several times a week on social media [links above]): Oil prices confirm TrumpFlation at the moment despite the fact that oil speculators have gone way out on a limb in being “Uber-Bullish.” They are all leaning to the Bullish side which usually portends the failure of a rally. As oil has gone much further than expected, let the market tell you when oil will finally, substantially correct from its current madly Bullish up trend. The “oil gurus” cannot.
Gold ETF (click chart to enlarge the chart; GLD): Gold lagging the SP500 Index (yellow line)…

Since the election…
Here you can examine the current important levels. The trend is UP, but GLD now needs a new market timing high above that top green line.
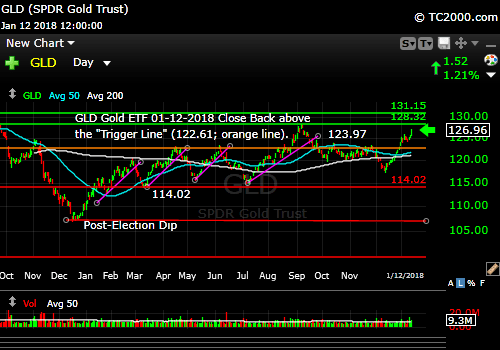
Gold Bull is a sign of coming TrumpFlation.
4. Interest Rate Market Timing – U.S. 10 Year Treasury Note Yield (TNX): Yields rose even further, so I am now back up to 75% of my total financial exposure (in excess of that held in SPY and IJH). I decided to use XLF exclusively, but suggested adding back Bank of America as well if you wanted greater “beta” in the up trend. (I sold BAC for 10.00% gains just before the Fed rate hike.) Higher beta simply means higher returns in a financial sector up trend and losses in a down trend.
The last three price points on the chart below are not particularly Bullish. You can see the level of 2.621% is not luring in enough buyers. Pushing through there after these last three days would be impressive. A reversal here back below the prior breakout would be negative for financials.
U.S. 10 Year Treasury Note Yield (click chart to enlarge; TNX, IEF, TYX,TLT,TBF):
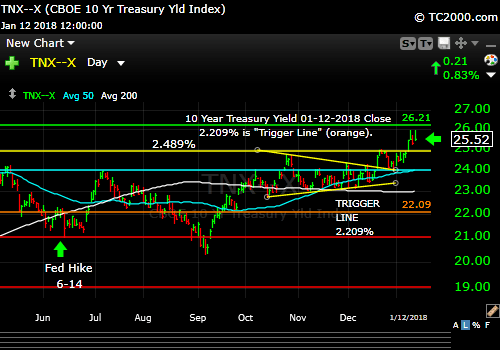
Rates pause below 2.621%.
Now, as usual, we need to review our three market timing signals (below the chart after you review it…)
Let’s review the three market timing signals together….
MY SIGNAL SUMMARY for a Further U.S. Stock Market Rally:
Stock Signal ON (Small Caps ABOVE “Trigger Line”). Staying long for now.
Gold Signal OFF (GLD is ABOVE the “Trigger line” which is positive for gold, and usually worse for stocks unless there is inflation moving faster than the Federal Reserve response to it. Then it’s gold up, stocks down.
Rate Signal ON (10 Year Yield ABOVE the “Trigger Line,” good for stocks, not bonds).
Thank you for reading. Would you please leave your comments below where it says “Leave a Reply”… or ask a question… Pay it forward too by sending the link to MarketTiming.Blog (that link will immediately connect them to this webpage) to a relative or friend. Thanks for doing that.
Note: My monthly newsletter is now CLOSED to new subscriptions.
Be sure to visit the website for more general investing knowledge at:
Standard Disclaimer: It’s your money and your decision as to how to invest it.
I thank Worden Brothers for the charting system I use to post these charts. If you want to know more about the charting system I use every day, go to my “Other Resources” page here: Other Resources It makes it much easier to follow along with me if you can see the charts and manipulate them on your own computer. It’s a great investment to have an excellent charting system. Check it out with a free trial at the link above.
Copyright © 2018 By Wall Street Sun and Storm Report, LLC All rights reserved.
