A Market Timing Report based on the 1-19-2018 Close, published Sunday, January 21, 2018…
I deliver focused comments on market timing once or twice a week. These are supplemented with daily “Tweets/StockTwits” (see links below).
UPDATE 1-23-2018: Bitcoin is Holding the Line…Two Lines…
Bitcoin is holding two major market timing support lines after two successful tests below both (see chart below). Remember, the precise value (even rough value!) of Bitcoin is an unknown, so it will tend to trade technically to an extent.
Predictions of bitcoin rising to 100,000 are not too helpful to those watching these recent highly volatile swings. Do not invest anything you cannot afford to lose. Recently central bank/government regulation efforts are popping up around the world as they begin to wake up to the potential of bitcoin to displace their currencies.
Regulation is therefore DESIRABLE, because without it, all cryptocurrency trading will be banned. Pay your taxes on all transactions (when you buy a house with BTC, that is a taxable event if you have a gain from the time you bought the BTC with US dollars for example and you can declare losses against gains). The revenue the government gets from cryptocurrency trading will please them and regulation will bring in more investors and drive out the criminal types and force them to hide under new rocks.
A further decline of BTC below the two market timing lines shown would cause a serious further decline in my view. This could be triggered by ANY move below the lower of the two recent lows shown in the chart. And it could happen at 3 am ET. That is why you must control your risk through proper position sizing.

Holding major support lines after two tests below.
Back to this week’s issue, including thoughts on when the first major correction will begin….
1. SP500 Index Market Timing: Both parties and our President decided to shut the government down this past Friday at 12 midnight. How much market reaction there is depends on how long it continues. It does not help to reduce the productivity of the nation, and such a situation was entirely avoidable in the first place. Government is not getting all that you want. It’s about compromise, like it or not. The truth will be told here. They ALL could have made a deal, as deals are not just what ONE side wants.
The Democrats were asking for a bone on DACA in the funding resolution, and the GOP decided to force them to the table on ALL of immigration to get their DACA deal. Now President Trump has dug his heels in and says the government must be reopened for him to consider DACA. And on it goes. In the end, both sides will have to compromise, the impact of this will be limited and we will move on, so I’m staying invested, but watching stops on profits of as well as principle in all trading positions.
At the moment, we can guess that the markets will not behave horribly on Monday, as there was no deal in sight well before the market closed on Friday. The S&P500 closed at a brand new closing high on Friday. The situation must be resolved within a reasonable period of time. If it is, this will have been just one more blip in a Bull market, one that is likely going to hit pause in the coming months.
When will the “pause” occur? I favor between now and “go away” time in May. It’s possible though that the “pause” will be in the summer or fall instead, but regardless, all of the gains going forward will be wiped out, before the Bull market resumes. That’s my view based on sentiment.
As I’ve told you, I’m concerned about the recent sentiment peak as outlined 2 weeks ago HERE. More on sentiment, just below the chart…
Keep up-to-date during the week at Twitter and StockTwits (links below), where a combined 33,300+ people are joining in…
Follow Me on Twitter®. Follow Me on StockTwits®.
SP500 Large Cap Index (click chart to enlarge; SPX, SPY): The new high was not that much higher than the prior four closes, so some deceleration is apparent.

Brand new high vs. recent off the wall sentiment.
Survey Says! Bullish sentiment rose somewhat this week as I expected, given the last extreme. Sentiment of individual investors (AAII.com) showed a Bull minus Bear percentage spread of +32.72% vs. +23.60% last week. The same sort of pattern occurred back in early 2011 during the ramp up to the final high preceding a large correction/Bear (>20% drop). This does not mean we’re going to jump out of the market entirely. We’ll be preserving profits and watching stops on excess exposure though to provide some cash to buy back exposure at lower prices.
| AAII.Com Individual Investor Sentiment Poll | ||
| Bulls | Neutrals | Bears |
| 54.11% | 24.50% | 21.39% |
| Thurs. 12 am CT close to poll | ||
2. U.S. Small Caps Market Timing: Small caps have been underperforming large caps since the November low as seen on the chart. The rising yellow line is SPY, the S&P500 Index ETF. Small caps are still ahead since the 2016 election, but the recent lag fits the picture of a market bracing for a drawdown. It’s harder to get out of small caps as it gets later at the party. Still, there has been a recent breakout and as long as the gains can be held, small caps can continue to move up. A reversal below the green line would result in further significant further losses.
Russell 2000 U.S. Small Cap Index (click chart to enlarge; IWM, RUT): Longer term view…
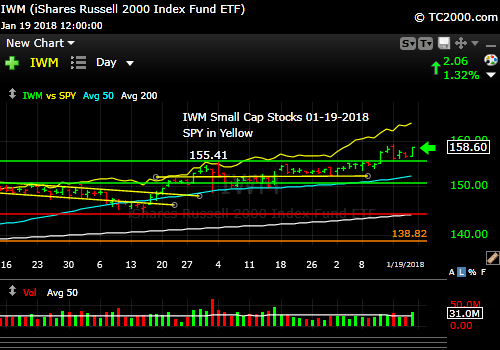
Small caps have been lagging large caps recently.
3. Gold Market Timing: Gold has been doing well, but now faces resistance levels just overhead, not to mention elevated interest rates which are a bit stretched, though rising. From the post-election low, GLD has not returned as much as the SP500 (and dividends are not included; SPY is in yellow on the chart below). Gold typically does poorly in times of economic strength with low inflation. Since mid-November, gold has been rising with rates, but that slowed a bit last week as rates went up to even higher highs. As discussed last week, gold can only work in a setting of rising rates if the Federal Reserve falls behind in raising rates ahead of inflation.
A factor that has been helping gold is the falling dollar. As the dollar would be expected to rise with rising rates and a robust economy, the fact that it has been falling is of concern. I believe the crux of this is TrumpFlation concerns. Trump is no fiscal conservative, and his tax cuts just make the entire fiscal picture worse despite the strength we’ve had in the economy. To the world, that means trouble for US debt repayment down the line, so rates rise and the dollar falls.
China is in the beginning stages of a “War on the U.S. Dollar.” They want the yuan to rule the world. They are currently making a move on the use of U.S. dollars to settle oil transactions in petrodollars. If U.S. leadership continues on the current path, the U.S. dollar will take a seat next to the British pound, the currency of a former empire. The dollar will still significant on the world stage, but will play second fiddle to China. The U.S. needs to wake up now, or it will lose the long game!
Gold ETF (click chart to enlarge the chart; GLD): Gold lagging the SP500 Index (yellow line)…

The rise with rates has slowed.
4. Interest Rate Market Timing – U.S. 10 Year Treasury Note Yield (TNX):
There was in fact an impressive move in Treasuries this week. It led me to max out my exposure to financials once again. The bond gurus, Bill Gross and Jeff Gundlach (former drummer now billionaire bond investing guru) say the Bear market in bonds is now upon us. This will mean further rotation of assets from bonds into stocks, which could help fuel the final rise of the markets and lead us to a Bear market.
But don’t despair because you can always find an ultra-Bull somewhere, this time appearing as Tom Lee, who has returned to being highly Bullish, predicting ELEVEN more years of a rising stock market with a wild ranging prediction for the top of 6,000 to 15,000 for the SP500 Index. This year, his target is 3025. Or you may find the less sanguine outlook of Morgan Stanley to be more on the mark. Listen HERE…
I would say that it’s not wrong to look at the big macro picture, but making numerical market predictions beyond the immediate few weeks or quarter is nonsense.
We’ll follow the technical market timing data as well as the fundamentals, and follow good position sizing and manage our exposures, and leave the wild guesses to the overpaid gurus.
U.S. 10 Year Treasury Note Yield (click chart to enlarge; TNX, IEF, TYX,TLT,TBF):

Rates up with dollar down means trouble.
Now, as usual, we need to review our three market timing signals (below the chart after you review it…)
Let’s review the three market timing signals together….
MY SIGNAL SUMMARY for a Further U.S. Stock Market Rally with Low Inflation:
Stock Signal GREEN
Staying long for now.
Note: I’ve changed my criteria for the equity signal for a further U.S. stock market rally to the following: Green = Bullish, Yellow = Neutral, Red = Bearish. Note that a Bearish signal does not mean we should not buy. It depends on what is going on in the economy and how oversold the market is at a given point whether the Bearish signal is to be sold, sold on the next bounce, etc. I will keep showing the prior orange line for now as a reference point.
Gold Signal RED
GLD is ABOVE the “Trigger line” which is positive for gold, and usually worse for stocks unless there is inflation moving faster than the Federal Reserve response to it. Then it’s gold up, stocks down. The dollar is playing a role against the backdrop of rising rates as discussed above!
Rate Signal GREEN
10 Year Yield ABOVE the “Trigger Line,” good for stocks, not bonds.
Thank you for reading. Would you please leave your comments below where it says “Leave a Reply”… or ask a question… Pay it forward too by sending the link to MarketTiming.Blog (that link will immediately connect them to this webpage) to a relative or friend. Thanks for doing that.
Note: My monthly newsletter is now CLOSED to new subscriptions.
Be sure to visit the website for more general investing knowledge at:
Standard Disclaimer: It’s your money and your decision as to how to invest it.
I thank Worden Brothers for the charting system I use to post these charts. If you want to know more about the charting system I use every day, go to my “Other Resources” page here: Other Resources It makes it much easier to follow along with me if you can see the charts and manipulate them on your own computer. It’s a great investment to have an excellent charting system. Check it out with a free trial at the link above.
Copyright © 2018 By Wall Street Sun and Storm Report, LLC All rights reserved.
