A Market Timing Report based on the 2-09-2018 Close, published Sunday, February 11th, 2018…
I deliver focused comments on market timing once or twice a week. These are supplemented with daily “Tweets/StockTwits” (see links below).
NOTE: My “Rate Shock Comments are in the 3rd and 4th sections below (under gold and interest rates)…they are a KEY to understanding the risks the markets are seeing now! The Volatility Volcano will erupt again soon IMO. I explain why in detail giving many historical examples.
Be patient and read through them carefully and you will have a good feel for how to trade the coming swings UP and DOWN in the global stock markets. …
1. SP500 Index Market Timing: What we’ve had is a major Volatility Spike in the markets, so I’m focusing this week first on the SP500 Index, and the volatility implications of the recent market action.
Some say it’s the “damn VIX products blowing up” which it likely is in part, but others add that the market seems to be in fear of rising rates and Fed hikes. I explain later why it was actually due to “Rate Shock” in the gold and interest rates sections below. In any case, let’s look at the history of massive VIX Volatility spikes and see what we can learn…
Please read through these examples slowly as they could provide a great map for the next 5-8 weeks or more of market turmoil!
If you enjoy and/or appreciate it, please indicate that in your comments below the post. I’d be very grateful for that. Thanks!
Before the Great Recession Market Crash Period
8-16-07 37.50 Nailed the low. Last rally still to come to 1576.09 on 10-11-07. Intraday low 8-16-07 was 1370.60. 1411.27 close. Run to next top from ID low was 15%.
POSSIBLE OUTCOME: If the current spike is also just a pre-cursor, we will see a marginal new high and then a slow market crash from the next major high.
10-06-08 58.24 SPX 1056.89 close. There was no point in trading the market until the 3-09 low. First time over 50 w eventual top at 89.53 10-24-08. Not a low! Went on to massive Great Recession March 2009 low of 666.
POSSIBLE OUTCOME: Remember the financial system was extremely unstable at the time which is NOT occurring now. I do not view this as the likely outcome. That is, I don’t believe YET that this is the beginning of a new Bear market. It bears watching though. I would expect the current low to hold within some tolerance as mentioned in another example below.
10-24-08 89.53 VIX Peak. temp. floor on SPX price but then fell to new low less than 1 mo later 11-21-08.
After the Great Recession Market Crash Period
5-06-10 40.71 Flash Crash #1. Closed at 1128.15. Temp. floor then bounce, and market fell back to July 1 lower low. Not the end! There was was a 17.13% drop from top to bottom. (see next)
POSSIBLE OUTCOME: To avoid the next big drop down, we cannot see the VIX rallying to a new high. The current VIX high was 50.30, which should not be challenged or broken significantly or we may see another drop (see next).
5-21-10 48.20 VIX Peak. Close at 1087.69 with final SP500 low -7.06% lower. Note that the lower ID low on Friday was only 2% lower than the VIX Peak Day close. After the May 2010 VIX Peak it took 2 more days to rally in a brief bounce that lasted a few days, fell back, rallied a small amount a second time in June, and fell back to a new low July 1 with 1010.91 low ID (intraday). Two failed bounces in other words until the final LOWER low. Then from that bounce, there was one more sig. retest above the lowest low.
3-16-11 31.28 VIX Peak. Nailed the low. Bounce then to brand new high on 5-2-11. Retest of prior low mid June. Bounce to lower high 7-7-11. Then a huge fall to 1st low 8-09 11 with 3 failed bounces and a final low 10-04-11.
8-08-11 48.00 VIX Peak. SPX Close at 1119.46 just 4% above the eventual low. THREE very high LOWS in VIX ended with a VIX top of 46.88 on 10-04-11, which was the same day as the final low in SPX price of 1074.77 a total drop from the lower high of 1347 or 20.22%! You could say there were 4 major price thrusts/bounces each correlated with a drop in the VIX and then the final recovery occurred. Only 3 of those 4 were significant bounces and each was associated with a VIX low. Each low hit nearly the same spot on the VIX chart by the way. After all that, there was STILL a greater than 50% (maybe 60%; you can calculate it) drop back toward the final low in November before the year end rally took hold! What a summer and fall!
COMPARISON: The SPX low of the current VIX Peak on 2-06 was already tested about 6% below the SPX low on the VIX high day (2-06-18).
POSSIBLE OUTCOME: The current test level could behave as in 2011, with the current low being a retest point, although in 2011, the first low was pierced a bit by 2.44%. Not enough to worry about. This means the final low may have already been seen but is likely to be retested and slightly transgressed.
10-15-14 31.06 VIX Peak. Nailed the SPX price low to the day! The difference was 1st that the peak was much lower than what we just saw and 2nd that there was a precursor VIX shock to a lower level when price moved down quickly around end of July/beginning of August 2014. There was a 30-40% retracement of the gains after that VIX peak.
8-21-15 28.38 Precursor Shock VIX high. SPX closed at 1970.89. Prior high 2132.82. Low to come was 1867.01.
8-24-15 53.79 Flash Crash #2. VIX Peak, a big one. SPX closed at 1893.21. First major low was 1867.01. Retest low 9-29-15 1871.91. Note the retest process took about 5 weeks. There was then a massive rally to a slightly lower high than the first run. 11-03-15 was the lower ID high of 2116.48. Then came the still lower early 2016 lows.
POSSIBLE OUTCOME: The final low was just 1.39% below the close of SPX on the VIX Peak day. If there is a big rally from here and/or after a retest, we’ll want to lighten up at the tops and rebuy lower.
12-14-15 26.81 VIX Peak. Nailed the low. Very minor low SPX after fall from 11-03 high. Market went on to early 2016 lows as noted above.
1-11-16 27.39 1923.67 close of SPX. Lows thereafter 1812.29 on 1-20-16 and 1810.10 on 2-11-16. Max drop of 5.91%.
1-20-16 32.09 VIX Peak. Nailed one of the lows. SPX 1859.33. As said, lows thereafter 1812.29 on 1-20-16 and 1810.10 on 2-11-16.
2-6-18 50.30 VIX Peak. Flash Crash #3. Now we’ll see how this compares to history.
CONCLUSIONS:
- The current VIX peak is one of the off the wall peaks, not the “Nail the Low Peaks.” This is the equivalent of a Flash Crash type of VIX Peak. This is not economically driven unless you believe the VIX products had nothing to do with this and I do not. If you want to argue inflation is going to rise inexorably from here, then we’re in trouble. I do not see that in the data I access from multiple sources. If you do, act according to your beliefs.
- This could still be a warning shot, an omen to huge trouble ahead, but we cannot invest based on a “possibility” of disaster. Left field event risk is always there. We will have to follow the evolution of VIX, the SPX price and economic and political inputs.
- It is likely in my view that the recent ID low will be retested and may be somewhat pierced (based on both 2010 Flash Crash and 2011 mini-Bear market and the 8-24-15 VIX Peak; 3 of 3 cited). For that reason I will keep a bit more cash on the side than usual, but not a lot. I would lower exposure even more if I thought the economy was breaking down soon. You can see my actual exposure to stocks and my split in US/Non-US at the social media links. Of course, adjust that to your taste and circumstances. I would be selling some on rallies if you need college funds in a year. Follow your own plan.
- It is possible a retest will hold w another -3-4% downside risk on an overshoot. It could be a bit bigger based on the Flash Crash of 2010, which implies a possible additional 5% drop vs. the 2-09 ID low (above 8% lower than the Friday 2-09 close).
- If there is a big rally from here before and/or after a retest, we’ll want to lighten up at the tops and re-buy lower if possible or re-enter higher if that fails. Trading this volatility over the next month or two could be lucrative for astute traders.
- If the current VIX spike is just a pre-cursor to a Bear Market, we could see a marginal new high with HIGHER retests just above the prior low and then a slow market crash from the next major high. That is what the 2007 data point says, but it’s just one point and there is not the same structural damage in the economy. I don’t favor this outcome for that reason most of all.
Keep up-to-date during the week at Twitter and StockTwits (links below), where a combined 33,300+ people are joining in…
Follow Me on Twitter®. Follow Me on StockTwits®.
SP500 Large Cap Index (click chart to enlarge; SPX, SPY):
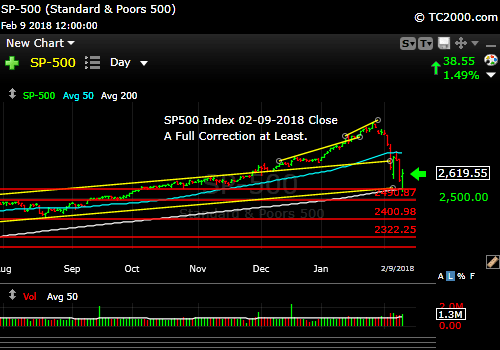
Volatility spike!
Survey Says! Sentiment of individual investors (AAII.com) showed a Bull minus Bear percentage spread of +2.02% vs. +16.01% last week.
This is in fact the correction I was expecting after the sentiment peak I went over in early January HERE. Investors were not able to experience the big down draft on Thursday, which would have discouraged them or the reversal on Friday off the lows which would have encouraged them. It may be a wash, and I believe sentiment has not turned Bearish enough to allow for a major rally off the Friday intraday low. One more reason for a retest!
| AAII.Com Individual Investor Sentiment Poll | ||
| Bulls | Neutrals | Bears |
| 37.03% | 27.96% | 35.01% |
| Thurs. 12 am CT close to poll | ||
2. U.S. Small Caps Market Timing: Short version: Stay out of small caps during these volatility swings if you agree we are headed to a retest unless you have tax issues to consider. UPDATE Mon. 12-12-2018: Note the first level of support was broken in the decline, while the next lower level held. This is why it has changed the equity signal to “Neutral to Bearish.” If small caps break this level, I would consider it Bearish at least short term. When the economy turns down, the market will head into what will be the next Bear market.
Russell 2000 U.S. Small Cap Index (click chart to enlarge; IWM, RUT): Longer term view…

Market timing sell signal on small caps. This lower support had better hold.
3. Gold Market Timing:
Update 2-12-2018: Gold moved up today as the dollar fell. It’s still very dollar dependent. That correlation has been nearly directly inverse since October 2016 – a long time. Don’t expect that to change too quickly unless a worldwide financial panic takes hold. Then the dollar and gold can move in tandem – UP. I posted the new chart below Mon. night.
MORE UPDATE BELOW – Keep reading because you MUST understand my hypothesis of how “Rate Shock” rather than inflation fear sent stocks down hard!
Interestingly, the Gold VIX (Volatility Index for Gold) has been rising since around the end of 2017 as this chart shows at Kitco HERE. It was rising before GLD topped and then continued rising. The up trend in volatility suggests gold may not yet have found a bottom. If stocks continue to sell off, gold won’t likely do well unless inflation fears continue to rise at the same time or if rates crash. Right now rates are down a bit for reasons I explain below and the dollar has staged a 6 day counter rally (see UUP for ex.), which hurts gold. Rising rates hurt gold usually, but not when the fear is the Fed falling behind inflation (this changed at the SP500 Index high as I explain below). Some say these fears are not warranted as there is slowing in the cards outside the U.S. which then can drag the U.S. down. Economic slowing usually does not correlate with rising interest rates as the Federal Reserve generally is lowering rates, not raising them.
The exception is when inflation is truly out of control, something I don’t see happening for a while. There are still too many deflationary pressures. There is a lot working against higher oil prices for example. The rig count has shot up with the oil price and oil prices have eased a bit. Yes, the trend is still up for now, but it will be vulnerable to world economic softness to come and further expansion of U.S. oil production. Could oil go up more? Yes. Will it stay there. I highly doubt it.
Short version in view of the stock correction: Gold will correct further if stocks crash further. Otherwise gold will trade with the US dollar (rising – meaning gold down) and interest rates (falling which can cause gold prices to rise), which provide opposing forces on the gold price.
I came to the conclusion on 2-13-18 that rates will move down not up from here. If that is true, where does gold go from here? Read the update…
Update 2-13-2018 12:27 pm: Gold could continue its up trend since its December low, when I believe inflation fears began to rise (and then turned to deflation fears at the top of the stock market – see below).
Why? Gold will rally IF the 10 Year Yield comes down now from its recent high of around 2.9%, and I believe it will. Falling rates mean lower real interest rate and a relatively weaker U.S. dollar on that basis. This would hurt financials, but help gold. It also ironically would hurt stocks in general too, as it would be a harbinger of disinflation and the subsequent risk of deflation.
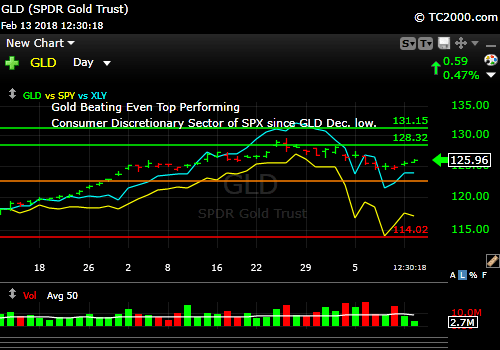
Gold since it’s Dec. low has beaten even top performing XLY after the recent market correction.
Update 2-12-2018 11:32 pm: THIS IS A KEY HYPOTHESIS I will be following with you…
I noticed a change in the relationship of gold to interest rates. This is a clue regarding inflation fears I believe. I’ll explain why I believe the downturn in stocks was due to a shift from inflation fears to deflation fears.
Until mid-December, gold fell when rates rose and vice versa and then in mid-Dec. gold suddenly started being positively correlated to rates, which indicates inflation fears. When there is little inflation and rates rise, gold falls, but gold has in fact been rising. Gold responds to “real interest rates,” so if rates rise and gold rises, it means real rates are FALLING – meaning rates are not keeping up with inflation. When rates outpace inflation, gold suffers, because you don’t need it as a hedge against rising rates!
Then ON EXACTLY THE DAY THE STOCK MARKET PEAKED 1-26-2018, gold FELL as the dollar rose and rates continued to climb.
IF the market believes inflation is NOT out of control, the dollar is supposed to rise on rising rates as it was, and gold should fall. Gold would have continued to rise with rising rates if the precipitating fear had been “inflation.” It wasn’t in my view. It was “Rate Shock.” Rates rising too fast ahead of inflation!
This means the actual driver behind the stock market sell-off was that RATES WERE RISING despite the decline of inflation fears.
When rates rise and inflation does not warrant the rise, that implies tighter monetary conditions than the inflation rate warrants.
That would produce economic slowing and deflationary pressure, which is what the markets fear most.
My conclusion is the markets after the Jan. 26th peak, were beginning to handicap a resumption of economic slowing and deflation in the coming year, which is already showing up in some places like Europe despite the continued optimistic view of European stock valuations. The valuations are probably generous considering the headwinds arising. This EU slowing with China’s slowing economy could start to press on U.S. growth down the line. This is what the markets may be anticipating. We will have to continue to follow the world’s economies to see how the inflation/deflation balance shakes out, but right now I believe there is a new concern embedded in this data that says interest rates rose too fast! It’s not the rate increase per se, as we know historically markets can continue to rally with rising interest rates, but the rate of increase in rates was the shock. I’ll call it “Rate Shock.”
Gold ETF (click chart to enlarge the chart; GLD):

Gold picked up some relative strength in the recent stock market decline despite it’s fall and turned up a bit today as the dollar sold off. The forces of rising dollar and falling rates impact the gold price, generally in opposite directions.
4. Interest Rate Market Timing – U.S. 10 Year Treasury Note Yield (TNX): TrumpFlation was the risk the market took notice of over the past 10 days. I said last week that rates would move down off the high as a “Risk Off” trade out of stocks after the Friday 2-02 Volatility. If stocks continue to climb, the yield could start rising to 3% again.
UPDATE 2-12-2018: Please read the above gold section, because I cover my “Rate Shock” hypothesis there, which is critical to this global stock market sell-off. The eerie thing about the last couple days of the sell-off is that rates never came down much, despite some flight from risk. Of course without any “risk off,” rates could have risen to 3% for the 10 Year Yield.
What this means is rates are likely STILL too high to sustain healthy economic growth despite what the pundits say. Central Banks are taking away accommodation too quickly for the global stock markets and the markets do not like it!
U.S. 10 Year Treasury Note Yield (click chart to enlarge; TNX, IEF, TYX,TLT,TBF):

The “Rate Shock” of rapidly rising rates may have precipitated the stock market decline. The timing works out to the day….
Now let’s review the three market timing signals together….
Do not use these signals as a trading plan. They are rough guidelines.
MY SIGNAL SUMMARY for a Further U.S. Stock Market Rally with Low Inflation:
Stock Signal YELLOW with SP500 Index in Neutral to Bearish Trend
I say Neutral to Bearish because small caps broke the prior consolidation level but are testing the next level down which could hold. It DOES say to stay out of small caps for now.
Note: I’ve updated my criteria for the equity signal for a further U.S. stock market rally to the following: GREEN = Bullish, YELLOW = Neutral, RED = Bearish.
Explanation: Note that a RED signal does not mean we should not buy. A GREEN signal does you cannot sell some exposure. It depends on what is going on in the economy and how oversold/overbought the market is at a given point whether the Bearish signal is to be sold, sold on the next bounce, etc. and whether a Bullish signal is to be bought or profits should be taken. YELLOW does not mean the end of the Bull or Bear. It means look for possible entry points within the existing trend, Bull or Bear, but preserve capital if the entry fails. Our strong intention is to buy low and sell high. By the way, I will keep showing the prior orange “Trigger lines” in the charts for now as reference points only; they have historical value for us from the post-election period.
Gold Signal YELLOW with Gold in a Neutral Trend.
GLD is coming off a failed breakout which makes it “Yellow” but ABOVE the “Trigger line” which is positive for gold, and usually worse for stocks at least on a relative basis, IF inflation is getting out of hand. Then it’s gold up (based on negative real rates of return on debt), stocks down (again, eventually that is, if inflation becomes too “hot”).
Rate Signal GREEN with 10 Year Yield in Bullish Trend (but could soon turn neutral from this high)
10 Year Yield ABOVE the “Trigger Line,” good for stocks, not bonds. I said last week: “Yet the trend is becoming too steep and a pullback in rates will likely start soon.” It is too soon to know whether this is a temporary high or not. Rates will move higher as the recovery progresses regardless of short term gyrations UNLESS we go back into recession, which would cause a big Treasury rally.
Thank you for reading. Would you please leave your comments below where it says “Leave a Reply”… or ask a question… Pay it forward too by sending the link to MarketTiming.Blog (that link will immediately connect them to this webpage) to a relative or friend. Thanks for doing that.
Be sure to visit the website for more general investing knowledge at:
Standard Disclaimer: It’s your money and your decision as to how to invest it.
I thank Worden Brothers for the charting system I use to post these charts. If you want to know more about the charting system I use every day, go to my “Other Resources” page here: Other Resources It makes it much easier to follow along with me if you can see the charts and manipulate them on your own computer. It’s a great investment to have an excellent charting system. Check it out with a free trial at the link above.
Copyright © 2018 By Wall Street Sun and Storm Report, LLC All rights reserved.

The historical VIX data points references are very useful! Thank you.
You are welcome Charles!