A Market Timing Report based on the 2-16-2018 Close, published Sunday, February 18th, 2018…
I deliver focused comments on market timing once or twice a week. These are supplemented with daily “Tweets/StockTwits” (see links below).
UPDATE 2-23-2018 after Close: I’ve added more exposure to the U.S. due to what I’m calling the “VIX Implosion.” Read my tweets (see links below) from today to catch up on what that means and I’ll discuss it further by this weekend’s post! Enjoy your weekend!
1. SP500 Index Market Timing: After a big storm, (and this is the Sun and Storm blog afterall!), there are usually more showers that pass through. Just as with a volcanic eruption, once the top blows off the volatility volcano, there are often more eruptions that follow. It’s the same idea with earthquakes and in fact volatility shares a lot in common with the vibration of the earth’s crust in that way. Once a market is shaken, it often goes through further gyrations after the first shock before equilibrating. Often the process takes weeks to a few months.
As the time cycles are being compressed by machines these days, it could be faster than before. The correction we saw off the Jan. 26th top was the fastest 10% or more correction in history, thanks very likely to both the rapid selling of long bond/Treasury positions as well as equity positions ensnared in the VIX products that blew up. I’ve told you what the likely ACTUAL cause of the downturn was last week HERE .
If you don’t read my issue from last week, you won’t know what hit you this week, so please take the time. In order to do the right thing in these market swings, you have to be oriented, or you’ll zig when you should zag.
Consumer Sentiment was reported as very strong on Friday (links to the data on my social media pages below), but despite that, XLY, the consumer discretionary ETF was weaker than the SP500 Index. That’s not a good sign for action to come, as XLY is a necessary leader in this part of the recovery. Even big tech with a 40% representation in QQQ was -0.45% vs. SPX +0.04%. Tech in SPX represented by XLK is a purer tech play and was -0.15%. Amazon played a role in the XLY performance of course as it was -0.89%, and it also impacts QQQ’s. Amazon is NOT in the tech ETF XLK.
I fully exited my position in financials as I now expect interest rates to fall from here. Even if there is a surprise rally from here, I expect 3% to contain the move in the 10 Year Treasury Yield. If it does not, the entire market will be hurting. This goes back to the reason for the downturn in the market in the first place – “Rate Shock,” as I explained in great detail last week ( and as you have read by now! ;)).
My conclusion is that the stock markets believe a TNX Yield (10 Year Treasury Yield) above 2.676% is (in the end) deflationary, meaning rates that high vs. the rest of the world and current conditions in the U.S. would actually cause economic activity to contract. Why would I say this? Because the stock market began selling off when rates jumped above that pre-jump high. Falling rates could actually help the NON-financial portion of the market – to a degree (they hurt when predicting outright DEflation as I’ve explained). Remember IWM small cap ETF is 18.1% financials.
You could counter saying the market has recovered substantially and is now “used to the idea of these higher rates.” If that were true, we would not pause at such an obvious spot on the chart.
Now I cannot say with complete confidence that this “Deflationary Rate Shock” fear will set in at this specific level in the stock market. I have engineered my now slightly lowered exposure to take advantage of a recovery to the last high, but I don’t expect it. That reduced exposure allows me to add back to the market on the next low.
I used this “Passive Shorting™” (a term I coined HERE) successfully in 2011, buying and selling Berkshire Hathaway stock several times before locking in a very low price off the final low that I rode to gains of well over 100%. I kept it until Buffett himself said his company was not likely to beat the SP500 Index in the coming years due to its size. Then I took his advice and moved my money to the SP500 Index. I also used cash to buy SP500 Index exposure during the 2015, winter 2016, and pre-election 2016 pullbacks. I bought SPY on 11-01-2016 when the market was afraid of a surprise Trump win and perhaps of a Clinton win that would be less friendly to markets. Buy low, sell high! You can do it using “Passive Shorting™.”
I expect there will be more downside work to be done with a test to anywhere between a slightly higher low, the same level, or as much as 10% below the last low on a flush in the market of weak hands. What I do not believe is that we’ll go straight up, but I’m prepared for that too as described.
The US economy IS still strong at this time and this should last at least a few quarters; however, cracks are showing up in Europe, China, and Japan both in market timing terms as well as economic terms, so this could impact US markets eventually (several quarters from now). What could help the U.S. markets? IF further stimulus effects manifest including infrastructure spending, we could see a further delay of the next major economic recession and stock market downturn in the US.
Next (after reviewing the chart below), let’s look at investor sentiment, which provides a warning this week…
Keep up-to-date during the week at Twitter and StockTwits (links below), where a combined 33,400+ people are joining in…
Followers know I regularly share my percentage exposure to equity markets vs. my “usual maximum exposure” at the social media links below. Few share this information…
Follow Me on Twitter®. Follow Me on StockTwits®.
SP500 Large Cap Index (click chart to enlarge; SPX, SPY):
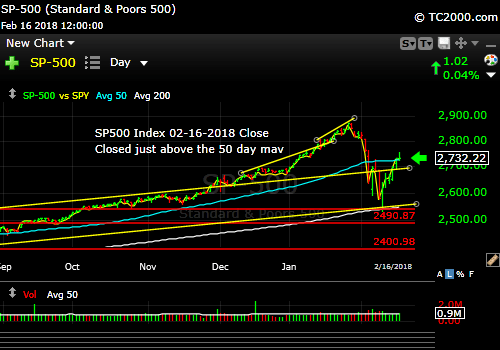
SP500 Index is at a perfect place to fail.
Survey Says! Sentiment of individual investors (AAII.com) showed a Bull minus Bear percentage spread of +27.11% vs. +2.02% last week.
That is a ridiculously Bullish number to see one week after the fastest 10% correction in stock market history. It is not extreme, no, but it’s still too much optimism too fast. Dumb can become dumber of course, hence the movie by that name. This number does not preclude a re-topping of the market. In fact, the ultimate fake-out WOULD be an immediate re-topping of the market. This adds to my thesis that the correction will need to be retested to shake out more Bulls. At this rate, we’ll be back to “uber-zealous” sentiment levels in another week!
| AAII.Com Individual Investor Sentiment Poll | ||
| Bulls | Neutrals | Bears |
| 48.52% | 30.07% | 21.41% |
| Thurs. 12 am CT close to poll | ||
2. U.S. Small Caps Market Timing: Small caps DID have a nice market timing bounce with large, so they were obviously “playable” off the bottom, BUT it was not actually worth the improvement in return, which (quick est.) was about 7.89% from the intraday low (recent lowest low!) to the Friday close for small caps and 7.63% for large. That is simply not worth the added beta risk in small caps.
Russell 2000 U.S. Small Cap Index (click chart to enlarge; IWM, RUT):

Small caps bounced, but added risk was NOT worth it.
3. Gold Market Timing: The Gold VIX (Volatility Index for Gold) fell on Friday, while the US dollar rose a bit. It should have increased as a higher US dollar is bad for gold. As I explained last week, we are dealing with interest rates fluctuations at the same time. The 10 Year Yield should fall from here, or close to here, which would pressure the U.S. dollar, as lower rates mean a lower return on our Treasuries and debt. That would help gold.
As far as market timing gold goes, be sure to watch for the US dollar to SELL OFF from here. If the US Dollar moves up, nothing but all out financial panic will help gold, and even then, the price of gold may be reset along with stocks if they should begin to fall again in a big way. Then gold could resume its rise as economic slowing and deflation hit significant portions of the world, initially outside the U.S., and then ultimately the U.S.
I lean Bullish on gold, for this reason: Gold outperformed stocks on the decline, and I expect stocks to retest lower.
Gold ETF (click chart to enlarge the chart; GLD):
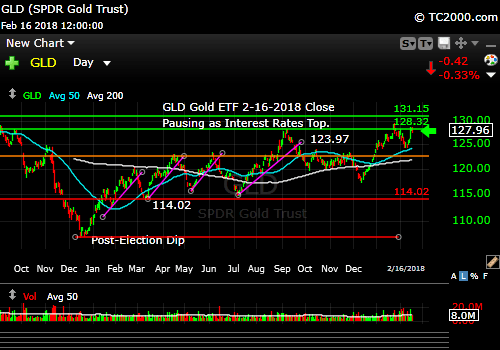
Gold will follow the dollar (but move in the opposite direction!).
4. Interest Rate Market Timing – U.S. 10 Year Treasury Note Yield (TNX): Rates will come down from here or from 3% as an outside possibility. The chart shows a Bearish upward wedge forming in market timing terms, which should bring rates back down soon, if TNX breaks the lower line on the wedge. Lower rates mean a weaker US dollar and stronger gold most likely. The “Rate Shock” idea I wrote about last week tells you the media hype about inflation fears is NOT the central issue. The main issue is DEFLATIONARY FEAR about overly tight monetary policy around the world and the associated “Rate Shock.”
U.S. 10 Year Treasury Note Yield (click chart to enlarge; TNX, IEF, TYX,TLT,TBF):

Rates should move down from here. If not, there will be even more trouble ahead for equities.
Now let’s review the three market timing signals together….
Do not use these signals as a trading plan. They are rough guidelines. I currently share my signals on social media (links above).
MY SIGNAL SUMMARY for a Further U.S. Stock Market Rally with Low Inflation:
Stock Signal YELLOW with SP500 Index Neutral
I say Neutral because this is a natural place for a breakdown in the progress that has been made.
Note: I’ve updated my criteria for the equity signal for a further U.S. stock market rally to the following: GREEN = Bullish, YELLOW = Neutral, RED = Bearish.
Explanation: Note that a RED signal does not mean we should not buy. A GREEN signal does you cannot sell some exposure. It depends on what is going on in the economy and how oversold/overbought the market is at a given point whether the Bearish signal is to be sold, sold on the next bounce, etc. and whether a Bullish signal is to be bought or profits should be taken. YELLOW does not mean the end of the Bull or Bear. It means look for possible entry points within the existing trend, Bull or Bear, but preserve capital if the entry fails. Our strong intention is to buy low and sell high. By the way, I will keep showing the prior orange “Trigger lines” in the charts for now as reference points only; they have historical value for us from the post-election period.
Gold Signal YELLOW in a Bullish Trend
GLD came off a failed breakout, but is now retesting the prior high,which is Bullish. If rates move down from here AND the dollar falls on that, then gold can move higher. Follow the breakout either way.
Rate Signal GREEN with 10 Year Yield in Bullish Trend (but it could soon turn neutral and fall due to the Bearish market timing Wedge [see above])
10 Year Yield ABOVE the “Trigger Line,” generally good for stocks, not bonds.
Thank you for reading. Would you please leave your comments below where it says “Leave a Reply”… or ask a question… Pay it forward too by sending the link to MarketTiming.Blog (that link will immediately connect them to this webpage) to a relative or friend. Thanks for doing that.
Be sure to visit the website for more general investing knowledge at:
Standard Disclaimer: It’s your money and your decision as to how to invest it.
I thank Worden Brothers for the charting system I use to post these charts. If you want to know more about the charting system I use every day, go to my “Other Resources” page here: Other Resources It makes it much easier to follow along with me if you can see the charts and manipulate them on your own computer. It’s a great investment to have an excellent charting system. Check it out with a free trial at the link above.
Copyright © 2018 By Wall Street Sun and Storm Report, LLC All rights reserved.
