A Market Timing Report based on the 3-02-2018 Close, published Sunday, March 4th, 2018…
I deliver focused comments on market timing once or twice a week. These are supplemented with daily “Tweets/StockTwits” (see links below).
1. SP500 Index Market Timing: We are still in a period of higher volatility, but on the edge of a very significant turn. I liked what I saw in a VIX breakdown from the Thursday high on Friday. The VIX Volatility Index rose to a new high and fell, but the catch is that although the VIX moved below the prior day’s low, it did not close at a new low. I don’t like it when I see the trading of a market is too “cute.” Regardless, the VIX needs to continue imploding Monday to continue the current rally; otherwise, we are headed into a sloppier trading trajectory, and a busier market timing scenario.
If Trump pushes the Tariff War into a true World War of Trade, the market could react much more negatively. Aside from that, the U.S. economy appears to be on track and have more upside given the corporate and, to a lesser extent, the individual tax cuts. If that were not the case, I would have lowered my U.S. exposure much more and left it lower. On Friday I added more exposure to the tech sector of the SP500 Index (XLK) during the pullback. It looked like the winner out of the 11 sectors at least for the near term.
I still have some cash on hand in case the POTENTIALLY higher low we’ve just seen does not in fact work out (I update my exposure to the market in relative terms so you can “adjust to taste,” on social media when I either buy or sell (see links below)). If the VIX does not break the lows of the past two days within a day or so, we will see either a full retest of the prior low or worse.
Keep up-to-date during the week at Twitter and StockTwits (links below), where a combined 33,400+ people are joining in…
Follow Me on Twitter®. Follow Me on StockTwits®.
SP500 Large Cap Index (click chart to enlarge; SPX, SPY):

The bounce must continue.
Survey Says! Sentiment of individual investors (AAII.com) showed a Bull minus Bear percentage spread of +13.87 vs. +21.86 last week. How low did sentiment go after the prior 2 Flash Crashes? After #1 (review them HERE), it hit -21.1% and -36-1% spreads after the crash day. Both of those occurred near the lows in the market following the Flash Crash.
What about Flash Crash #2? After that one, the spread bottomed at -11.8%, again fairly close to the low in the S&P 500 Index. The low hit this time was 2.0% for the poll closing 2-07-18. That day’s close was at -6.6% from the top vs. the biggest intraday drawdown of -11.75%.
I would have liked to have seen a lower sentiment low after the fall we’ve experienced from the highs, but perhaps it’s too much to expect considering the speed of the VIX rise and fall. I don’t think sentiment provides much of an edge in assessing where the market is compared to when we saw the excess Bullishness in the Jan. 3rd report that fueled the rise to the Jan. 26th high in the SP500 Index.
| AAII.Com Individual Investor Sentiment Poll | ||
| Bulls | Neutrals | Bears |
| 37.28% | 39.31% | 23.41% |
| Thurs. 12 am CT close to poll | ||
2. U.S. Small Caps Market Timing: The lack of a US Tariff War impact, at least in direct terms, may be helping the small caps to outperform the large caps off the last low. Interest rates will be falling somewhat, not rising per the consensus (see my interest rate section below), which could impact the financial component of the Russell which stands at about 18.1% as of March 1st. That upper green market timing line may be a point that Bears enter to attack. Stick with IWO (growth) over IWN (value) for now, as growth is favored in a growing economy.
Russell 2000 U.S. Small Cap Index (click chart to enlarge; IWM, RUT):

Small caps are leading large back up to the prior high.
3. Gold Market Timing: Gold has a chance to bounce as the dollar falls on falling U.S. interest rates. That’s the way the dance goes… All bets are off if…well, I explain that IF below…
Gold ETF (click chart to enlarge the chart; GLD):
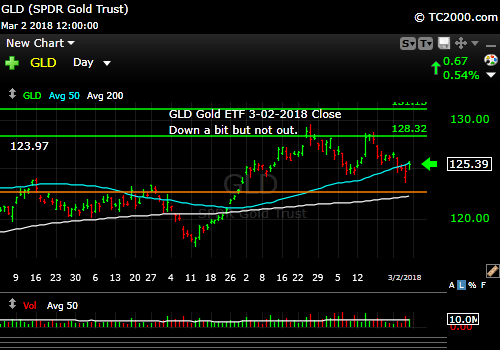
Gold should rally if the dollar continues its fall.
4. Interest Rate Market Timing – U.S. 10 Year Treasury Note Yield (TNX): I told you last week the next Wall Street “Story” will be about the “Goldilocks Scenario” where interest rates head lower, while growth continues. Remember just a couple of weeks ago the worry was and is still for some, INFLATION, not lower interest rates! Pay attention to what markets are DOING and to what economies are DOING, not where the Crystal Ball readers tell you they are going. The Federal Reserve, even with their unlimited resources compared to most prognosticators cannot even get it right! They recently had a special meeting aimed at helping them understand inflation better. They’ve been off target with their predictions for years, and they don’t understand why that is!
Hear this “good and clear,” and you’ll save yourself a LOT OF MONEY: Anyone who says they know where the economy or the stock market will be 1 year from now is a fool. Don’t trust them. Risk managing based on valuation levels and sentiment levels I can deal with, but only within a range of guesses. They are still just guesses. When I choose certain sectors or countries to invest in, I am only doing it with an awareness (as best I can achieve it) of what the charts and economics are saying NOW/in the near future (1-3 months). When the economies change for the worse, I get set to exit, and when the charts change, I exit. That is the point of market timing.
U.S. 10 Year Treasury Note Yield (click chart to enlarge; TNX, IEF, TYX,TLT,TBF):

Rates falling again following break of the wedge.
Now let’s review the three market timing signals together….
Do not use these signals as a trading plan. They are rough guidelines. I currently share my own moves on social media (links above).
MY SIGNAL SUMMARY for a Further U.S. Stock Market Rally with Low Inflation:
Stock Signal YELLOW with SP500 Index Neutral
The SP500 Index must rise above 2789.15 to turn Bullish again. Right now the pessimistic view is that we’ve formed a lower high on the chart above.
Note: I’ve updated my criteria for the equity signal for a further U.S. stock market rally to the following: GREEN = Bullish, YELLOW = Neutral, RED = Bearish.
Explanation: Note that a RED signal does not mean we should not buy. A GREEN signal does you cannot sell some exposure. It depends on what is going on in the economy and how oversold/overbought the market is at a given point whether the Bearish signal is to be sold, sold on the next bounce, etc. and whether a Bullish signal is to be bought or profits should be taken. YELLOW does not mean the end of the Bull or Bear. It means look for possible entry points within the existing trend, Bull or Bear, but preserve capital if the entry fails. Our strong intention is to buy low and sell high. By the way, I will keep showing the prior orange “Trigger lines” in the charts for now as reference points only; they have historical value for us from the post-election period.
Gold Signal GREEN in a Bullish Gold Trend
No big change from last week: Remember GLD is being used as an indicator for the ECONOMY here. Gold coming off a major high is GREEN for the economy. The signal is NOT a gold signal here. A great economy should mean higher rates, dollar up, and gold down except when inflation is not being headed off by the Fed. Then gold can rise despite the stronger economy. I suspect gold will start rising again and the signal will turn red as rates continue to FALL, and the dollar continues to fall in turn. The signal will be back to RED when GLD makes a new recent high.
Rate Signal YELLOW with a Bullish 10 Year Yield Trend. Remember this too is a signal for a “further stock market rally” as it’s being used here. The Bearish wedge break shown above is critical here and that’s where the “yellow” signal arises. Rates are falling for the short term at least in my view. Remember “Bullish” for yields is Bearish for bonds and vice versa.
For the near term move, the bond setup is Bullish due to the wedge break. Longer term, I expect rates to gradually rise as the recovery matures and the fiscal stimulus either wears off or forces the Fed to raise rates repeatedly due to inflation finally increasing. “Bearish” for the 10 Year Yield would be a fall in the 10 Year Yield below the prior important highs of 2016 and 2017.
Remember that Goldilocks feelings (growth with relatively low rates) will vaporize if and when we return to a worldwide slowdown with deflationary fears. Then rates would plunge, causing bonds to make big gains and gold to rally strongly.
Thank you for reading. Would you please leave your comments below where it says “Leave a Reply”… or ask a question… Pay it forward too by sending the link to MarketTiming.Blog (that link will immediately connect them to this webpage) to a relative or friend. Thanks for doing that.
Be sure to visit the website for more general investing knowledge at:
Standard Disclaimer: It’s your money and your decision as to how to invest it.
I thank Worden Brothers for the charting system I use to post these charts. If you want to know more about the charting system I use every day, go to my “Other Resources” page here: Other Resources It makes it much easier to follow along with me if you can see the charts and manipulate them on your own computer. It’s a great investment to have an excellent charting system. Check it out with a free trial at the link above.
Copyright © 2018 By Wall Street Sun and Storm Report, LLC All rights reserved.
