A Market Timing Report based on the 3-09-2018 Close, published Sunday, March 11th, 2018…
I deliver focused comments on market timing once or twice a week. These are supplemented with daily “Tweets/StockTwits” (see links below).
1. SP500 Index Market Timing: I used market timing and deployed more cash near the low on 3-01 and 3-02, and a bit more on 3-06, and very little on 3-07 to add to a prior buy in a tech stock mentioned at the social media links below. This Friday’s close gives us a very interesting set-up, because three of four markets are “On the Line,” including the SP500 Index, gold and interest rates, while IWM is stronger as I explain in detail below.
A key part of the Bull set-up is this: TNX would ideally hold below 2.897% (on Friday I said 2.895%, but I’d allow the former), and definitely must hold 2.925% or we have a re-topping of the prior high in the 10 Year Treasury Yield and a risk of even higher rates. That would be taken badly by the equity markets around the world, because, as I wrote HERE, the market has already decided that even the rates we have now are on the restrictive side.
I revealed the “tripwire” market timing number HERE (the rate above which the market became disturbed). Would the economy die at the current rates? No, but the reaction to the market when we made the climb to these levels was telling as I’ve explained. I believe current U.S. rates may actually be a bit too restrictive relative to prior conditions considering the slowing of economic data particularly in Europe, but also in China and Japan. HERE is a graph of Japanese GDP that appears to be rolling over from lower highs (click on the 5 year view). The annual numbers look OK, but they are likely topping out now. Sell high, buy low. That is what I coined as “Passive Shorting™” HERE.
I have closed out some foreign exposures aggressively, moving that exposure back to the strongest U.S. sectors. You can see what I do every day at the links just below…
Want the Bullish technical view for SP500 Index market timing? Note the magenta lines. They form an up trend that could continue, and we are only at the middle of that up trend, not at the top yet. The next decline could in fact occur at the upper magenta line, not at the current possible double top with the prior daily high. I will admit, I could have included the “swoon low” in the lower magenta trend line, and had I done so, you’d see an upward wedge, which is Bearish. For now, I’ll wait for a new high above the 2-27 high.
Keep reading, because in the last section I’ll reveal the exact sequence of events I want to see in the charts early in the week for the market to pivot UP rather than down from here. Make no mistake (as GW would say), this is a key pivot point.
Keep up-to-date during the week at Twitter and StockTwits (links below), where a combined 33,400+ people are joining in…
Follow Me on Twitter®. Follow Me on StockTwits®.
SP500 Large Cap Index (click chart to enlarge; SPX, SPY):
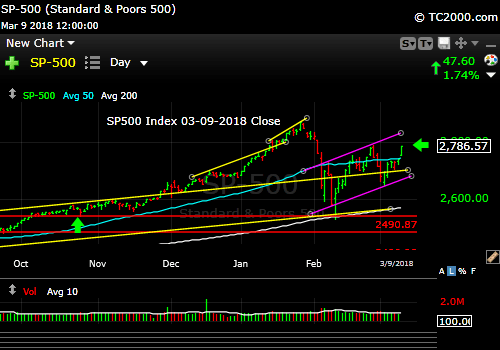
Up or down from here? Small cap growth and tech say UP.
Survey Says! Sentiment of individual investors (AAII.com) showed a Bull minus Bear percentage spread of -1.98% vs. +13.87 last week. We still have not reached the sentiment spread lows of the prior Flash Crashes (see previous issue). I don’t think that is lethal, but it’s one point of caution when investors don’t turn Bearish enough on downturns. I would not use this fact to bet against a re-topping of the SP500 Index however.
| AAII.Com Individual Investor Sentiment Poll | ||
| Bulls | Neutrals | Bears |
| 26.40% | 45.21% | 28.38% |
| Thurs. 12 am CT close to poll | ||
2. U.S. Small Caps Market Timing: Insulation from a possible US Tariff War, at least in direct terms, is clearly helping the small caps. When I say “small caps,” let me be clear that although IWM (small caps; Russell 2000) did better than the SP500 Index off the top and off the 2-08 closing low, it was IWO (small growth) that won. IWO also beat IWN (small value) off the 1-26 top. IWO is also leading and closed at an ALL TIME HIGH on Friday (IWM is shown in the chart below and is weighed down by IWN stocks).
The remarkable thing is small growth (IWO) did not drop as far on a closing basis as did SPY in the big decline. This is not the usual relationship of the two at bottoms. Usually small caps overshoot to the downside due to their lower floats and higher beta. Even if you step back to the pre-election low and look at returns to today, small cap growth has given large cap tech (XLK) a run for it’s money. Big tech won over small growth over that period, but small caps still nicely outperformed the S&P 500 Index (SPY).
Bottom line? Buy small growth when the economy is growing if you are going to put assets into the small cap space. Buy pullbacks. Don’t chase!
Russell 2000 U.S. Small Cap Index (click chart to enlarge; IWM, RUT):
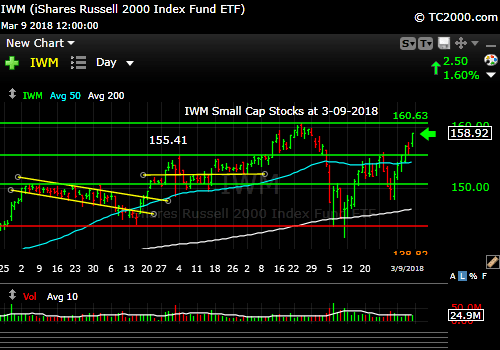
Stick with small cap growth if you buy small caps. Buy pullbacks only.
3. Gold Market Timing: Rates, if contained and then falling as discussed, will mean down dollar and up gold. If not, gold will do poorly.
Gold ETF (click chart to enlarge the chart; GLD):
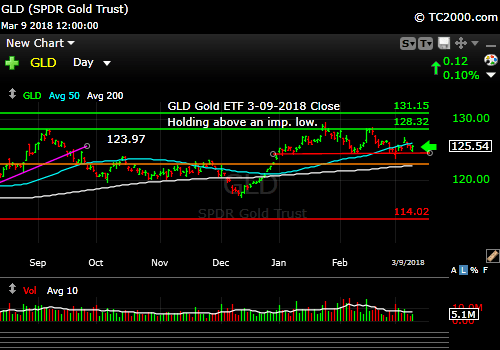
Rates must fall for gold to rally. The dollar in turn must weaken.
4. Interest Rate Market Timing – U.S. 10 Year Treasury Note Yield (TNX): Rates must move down from here for stocks and gold to continue upward. We get CPI and PPI data out next Tues. and Weds. respectively. Those numbers could have a big impact on the current chart. Nonfarm Unit Labor Costs rose a brisk 2.5% quarter over quarter, but for 2017 they were up only 0.4% after rising 1.1% in 2016 as noted HERE. Higher wage pressure was the theme during the recent decline, so we’ll see if that translated into CPI measured inflation or not. Heads up on Tuesday morning!
Avoiding a Big Third Wave Down:
So what must happen for the SP500 Index to move still higher rather than rolling over at a double lower top, resulting in a big third DOWN wave?
- Rates must stay below my numbers (noted above) and then decline. The first decline could be contained by the prior breakout of 2.621%. That is also the base of the broken wedge.
- The U.S. dollar weakens a bit OR stays flat. Assets moving into the U.S. for better treatment due to Trump tax reform at the corporate level and flight from weaker stock markets/economies could both help keep the U.S. dollar from falling dramatically. There is a limit to how low the dollar can go now, as Europe is already slowing; hence, the Euro will likely fall and keep the dollar up. If Europe slows too much it could drive the U.S dollar up too much and hurt U.S. multinational profits over the short to intermediate term. The U.S. stock market (esp. large caps) is most vulnerable now to strength in the U.S. dollar, which could come rising US rates (not what I favor) OR from Eurozone/China/India slowing. Money jumps from the the weakest to the strongest economies. The latter would be good for the U.S stock markets unless worldwide slowing is so pronounced as to significantly impact U.S. corporate profits. This hurts multinational large cap stocks the most.
- The SP500 Index needs to rise above the 2789.15 high on 2-27-2018.
- Current market leadership must continue higher. That means XLK and IWO must make higher highs.
U.S. 10 Year Treasury Note Yield (click chart to enlarge; TNX, IEF, TYX,TLT,TBF):

Rates must fall now or stocks will likely turn lower.
Now let’s review the three market timing signals together….
Do not use these signals as a trading plan. They are rough guidelines. I currently share my own moves on social media (links above).
MY SIGNAL SUMMARY for a Further U.S. Stock Market Rally with Low Inflation:
Stock Signal GREEN with SP500 Index Neutral
Wow, this held up for another week: Last week I said: “The SP500 Index must rise above 2789.15 to turn Bullish again. Right now the pessimistic view is that we’ve formed a lower high on the chart above.” The signal is GREEN because it’s based on small cap performance. Small caps are back in an up trend already, and IWO is at an ALL TIME HIGH! This set-up of both TECH and small cap growth at new highs is itself Bullish for the SP500 Index. But the proof will come early in the week, perhaps after tame CPI data, if that occurs.
Note: I’ve updated my criteria for the equity signal for a further U.S. stock market rally to the following: GREEN = Bullish, YELLOW = Neutral, RED = Bearish.
Explanation: Note that a RED signal does not mean we should not buy. A GREEN signal does you cannot sell some exposure. It depends on what is going on in the economy and how oversold/overbought the market is at a given point whether the Bearish signal is to be sold, sold on the next bounce, etc. and whether a Bullish signal is to be bought or profits should be taken. YELLOW does not mean the end of the Bull or Bear. It means look for possible entry points within the existing trend, Bull or Bear, but preserve capital if the entry fails. Our strong intention is to buy low and sell high. By the way, I will keep showing the prior orange “Trigger lines” in the charts for now as reference points only; they have historical value for us from the post-election period.
Gold Signal YELLOW in a Bullish Gold Trend
No big change from last week: Remember GLD is being used as an indicator for the ECONOMY here. Gold coming off a major high is GREEN for the economy and the stock market. The signal is NOT a gold signal here. A great economy should mean higher rates, dollar up, and gold down except when inflation is not being headed off by the Fed. Then gold can rise despite the stronger economy. I suspect gold will start rising again and the signal will turn red as rates continue to FALL, and the dollar continues to fall or stay about flat in turn (read above for more). The signal will be back to RED when GLD makes a new recent high.
Rate Signal YELLOW with a Bullish 10 Year Yield Trend. Remember this too is a signal for a “further stock market rally” as it’s being used here. The Bearish wedge break shown above is critical here and that’s where the “yellow” signal arises. Rates are falling for the short term at least in my view. Remember “Bullish” for yields is Bearish for bonds and vice versa.
For the near term move, the bond setup is Bullish due to the wedge break. Longer term, I expect rates to gradually rise as the recovery matures and the fiscal stimulus either wears off or forces the Fed to raise rates repeatedly due to inflation finally increasing. “Bearish” for the 10 Year Yield would be a fall in the 10 Year Yield below the prior important highs of 2016 and 2017.
Remember that Goldilocks feelings (growth with relatively low rates) will vaporize if and when we return to a worldwide slowdown with deflationary fears. Then rates would plunge, causing bonds to make big gains, gold to rally strongly, and stock markets to decline in a big way. Remember that any rapid reset could hurt gold as well as liquidity is sought.
Thank you for reading. Would you please leave your comments below where it says “Leave a Reply”… or ask a question… Pay it forward too by sending the link to MarketTiming.Blog (that link will immediately connect them to this webpage) to a relative or friend. Thanks for doing that.
Be sure to visit the website for more general investing knowledge at:
Standard Disclaimer: It’s your money and your decision as to how to invest it.
I thank Worden Brothers for the charting system I use to post these charts. If you want to know more about the charting system I use every day, go to my “Other Resources” page here: Other Resources It makes it much easier to follow along with me if you can see the charts and manipulate them on your own computer. It’s a great investment to have an excellent charting system. Check it out with a free trial at the link above.
Copyright © 2018 By Wall Street Sun and Storm Report, LLC All rights reserved.
