A Market Timing Report based on the 4-06-2018 Close, published Sunday, April 8th, 2018…
I deliver focused comments on market timing once or twice a week. These are supplemented with daily “Tweets/StockTwits” (see links below).
1. SP500 Index Market Timing: What’s changed in a week? Not much. We are dealing with the same old range that has held our attention for 10 market trading days now. This is day trading heaven, if you catch the swings correctly. It’s sort of like “swing trades” compressed into single days!
During the ups and downs of the last 2 months, I’ve been taking off exposure on some of the breaks and more recently on the bounces and putting on exposure at the lows. But not at the Friday low. I was not convinced by the VIX volatility index that the water was safe to re-enter. At the same time, on a technical market timing basis, adding near the low Friday was a reasonable thing to do, provided you are willing to SELL that exposure if support fails.
I discussed last week that earnings could well save the S&P500 this coming week. Earnings start in earnest on Friday with a couple of large companies reporting Weds. and Thurs. (detailed on social media; links below) They had better save it, because you can see the alignment of support in the chart below at the lower yellow up trend line, which is very close to the 200 day moving average as well as to the recent lows of the wild consolidation we’ve been in for two trading weeks. That triple support had better hold.
As said, the 200 day moving average is just a guide and not a trading signal. In fact, if you used it as a signal over the past two weeks, you’ve experienced whiplash. I assess what the market is doing in other ways at a given level, rather than key off the level itself.
We are now at the decision point and the lines in the sand are easily seen. The first transition is from a “correction” to a “Mini Bear” should the market fall from here. A “Mini Bear Market” will occur by my definition if we close and continue below the ultimate support (Feb. intraday low is the final checkpoint). A quick test below is not enough. A “Mini Bear” will in turn only becomes a “Big Bear” under the conditions that I laid out in detail HERE (Bear Types defined there too! See the blue text).
Trump Tariffs are not a market killer yet, just a market maimer. The best Bulls can hope for (I am a market and political independent, not a Bull, Bear etc.) is very strong earnings and projections. Watch the reaction to early earnings and especially Friday earnings carefully. It could define an early pattern of what to expect with other companies and especially the market as a whole.
I promised to tell you the best ways to WIN in this rough, volatile market, but I’ll save that for the end… Let’s review the SP500 Market Timing chart and then look at the small caps…
SP500 Large Cap Index (click chart to enlarge; SPX, SPY):

Recovery vs. Bigger Drop?
See what my exposure is at the social media links just below…
Keep up-to-date during the week at Twitter and StockTwits (links below), where a combined 33,400+ people are joining in…
Follow Me on Twitter®. Follow Me on StockTwits®.
Survey Says! Sentiment of individual investors (AAII.com) showed a Bull minus Bear percentage spread of -4.74% vs. -3.39% last week. The change is almost insulting to the volatility in the market! 😉 This raises a note of caution about the probability of a strong rally from here, even if a bounce occurs. The data is not decisive however, as it is not at an extreme of Bullishness either. It’s mildly Bearish.
| AAII.Com Individual Investor Sentiment Poll | ||
| Bulls | Neutrals | Bears |
| 31.90% | 31.47% | 36.64% |
| Thurs. 12 am CT close to poll | ||
2. U.S. Small Caps Market Timing: Small caps are still outperforming SPY both from the 1-26 high and from the last high. Comments from last week still apply HERE. The Friday close was just off the low of the current consolidation range just as it was for SPY. The market timing setups are about the same with IWM floating at a higher level vs. the Feb. low.
Russell 2000 U.S. Small Cap Index (click chart to enlarge; IWM, RUT):

Down Friday, but what will earnings bring?
3. Gold Market Timing: The Gold ETF (click chart to enlarge the chart; GLD): is following the U.S. Dollar like a little puppy. Gold is not following rates well now, and it makes sense that the dollar and rates are less correlated as well. The market does NOT see rising rates as good for the U.S. dollar or the U.S. equity market, which it would be if the economy were going to be even stronger going forward.
Preserve gold profits if you have them and ADD to your positions only if gold can break the obvious lid. Gold is holding up better than SPY during this correction, but is still down about 1.5% from the 1-26 SPY top.
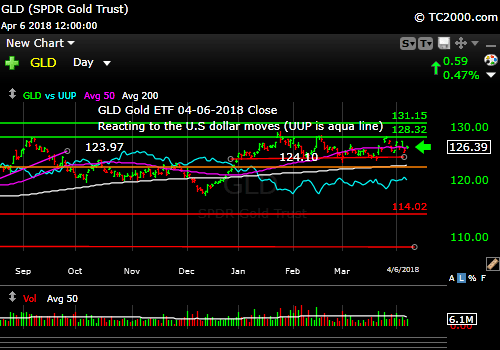
As the U.S. Dollar goes, gold goes opposite!
4. Interest Rate Market Timing – U.S. 10 Year Treasury Note Yield (TNX): Rates are still moving in the wrong direction. They rose to resistance on Friday and fell. This is why we are avoiding financials in general – until the situation changes.
U.S. 10 Year Treasury Note Yield (click chart to enlarge; TNX, IEF, TYX,TLT,TBF):
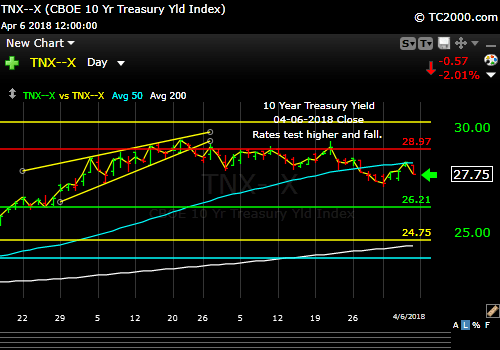
Rates rose to 2.795 and fell.
How Do You Beat the Market in this Volatile Period?
NOT BY:
- Holding the SP500 while it is going up and down, and lately mostly DOWN.
- Sector selection when all sectors are selling off.
- You may beat the SP500’s loss, but you won’t make a real return by holding either gold or the more recent “craze” among some pundits of commodities, when they are actually still falling with the SPX, just less.
- Holding bonds when rates will likely rise into the CPI rise over the next few quarters.
- Selling the lows! (meaning DO NOT DO THAT!) We could be at a big turn up or down from here, so selling SP500 Index correlated stocks/ETF’s at this low could be as wrong as it could be right. If you are overexposed to the market, you could still of course sell some on bounces. The point is, it’s late to sell the current decline without another breach of support (HERE!). If the Bull market recovers from here, I’ll be adding exposure back. But I am not taking off more exposure unless the market weakens further or on a weak/failed bounce.
You do it (beat the S&P500 and counteract at least some of the losses in broad market exposure you continue to hold) by:
1. Holding more cash at highs and less cash at lows: that is what “Passive Shorting™” is about as described HERE. (If you like that page, please “Like” that page using the Facebook Like button please.) Buy low, sell high and repeat…
2. A corollary of #1: Preserving profits, especially on bounces, but on falls if you have to. If you give up big profits so you can be “a good buy and holder,” you won’t beat the market! Defend them at a reasonable level.
3. Selling FIRST all holdings (stocks and ETFs) you have that are failing vs. the SP500 Index on a relative basis vs. the 1-26 high or the lower recent high. Otherwise, you’ll have no hope of beating the SP500. Move some of that cash back into the SPX (or stronger stocks) on the lows and sell it at the highs. If you have some reason for ignoring this advice for an individual stock, fine. But be clear in your decision making process.
4. Buy stocks that you know will produce strong earnings growth even in a slowing world economy. Not as easy a task as most companies do worse when the economy is worse. They must be outperforming the SPX for this to work, and buy them off their lows, not their highs. If they start to weaken, sell them as close to the highs as you can.
5. Speculate with a very small part of your assets on the double or more baggers that will result from buyouts, such as biotech companies, but there may be others that you will discern from your own personal background in business. Growth will be sought after by larger companies in a slowing world economy.
6. Do NOT sell stocks that remain stronger than the market (SPX) off the 1-26 high and/or off the most recent lower high. Sell your SPY correlated exposure (after selling the worst!) before you sell your strongest positions!
7. Don’t chase stocks or ETF’s when it’s actually “too late,” such as when the SPX is back testing a prior high. Buy low, sell high. Don’t chase high and try to sell higher or you’ll end up booking losses to protect capital or just ride further losses down.
8. If you have even more time, you can try shorting individual stocks/the market at the peaks, but for those of us who do not like betting in both directions at the same time, we’ll stick to Passive Shorting™ as the next best approach. You can fall behind quickly when you have not only reduced your exposure, but are also partially short the market. Alternatively follow someone who shorts stocks well and stick to their plan, not yours if you are not an advanced trader. You may have to eat some large losses on the bounces if Trump comes out suddenly with a new idea on a Sunday night! Take profits quickly when short for that reason. Riding shorts for long periods is fraught with error. Even the worst diseases heal in time. So do companies. Look at the miserable hedge fund performance around headline names for examples. There are exceptions of course, but watch out for the traps.
Why don’t I short stocks in general? I have the feeling of greater responsibility to be glued to the screen when I’m short something. If you miss one news item, you can miss a 5% move. I don’t like losing 5% of my money in anything in one day. It happens, but I don’t set myself up for it.
9. Store some cash simply as plain old 100% liquid cash, so you can move it quickly to buy the lows, and some you may want to park in short term (1-12 mo) Treasuries. Realize you may have to take a small loss if you want to sell some of these to buy stocks. Don’t buy any bond that is NOT liquid! Buy individual bonds, NOT bond funds, whenever possible as the funds could all sell off together if inflation goes the wrong way. Fleeing investors can drive illiquid bonds down quickly as they did in 2008. Otherwise use a “cash account” instead with a fixed rate of interest.
Of course, decide for yourself what you are comfortable with, but I for one will apply “Passive Shorting™” and don’t intend to watch the market give up 20% without taking further action and then move to the -50% level vs. the high without further action. I share my exposure level on social media (links above), as mentioned. Some of my regular readers are more aggressive in trading the swings than I am and will at times outperform my allocations. If you find that works for you, great!
Decide what you want your exposure to be to stocks, bonds, gold, etc. Some day…maybe this year, but maybe 2-3 years from now, the “Big Bear” could happen. We don’t know how low this move can take us yet. If you have no clue what your percent exposure is to various sectors and countries, you had better get organized with a spread sheet. Otherwise you are flying blind. Compare your results to the market regularly, even daily. Otherwise plan to work your butt off for an extra ten years or so to make up for it! I’m tough. 😉
We may be ready for a bounce and an exclamation of “that was it,” but regardless, prepare your plan. If it is to do nothing and ride your investments up and down, fine. At least do what you do consciously!
Now let’s review three key market timing signals together….
Do not use these signals as a trading plan. They are rough guidelines. I currently share my own moves on social media (links above).
MY SIGNAL SUMMARY for a Further U.S. Stock Market Rally with GDP Growth and Low Inflation:
Stock Signal YELLOW with a Neutral SP500 Index trend. The market will have to break further to change the signal. Others are reporting “trend breaks.” I do not agree, but I will admit to the possibility of a full 3rd wave down (covered last week), which would define a Bear Trend for me.
Gold Signal YELLOW with a Neutral Gold Trend. You may as well wait to buy a breakout in gold as the distance to the top is not that great. Preserve gold profits if you have them.
Same Idea as Last Time: The failure to make a new high makes the trend “Neutral” for me rather than Bullish. To Repeat: Remember GLD is being used as an indicator for the ECONOMY here. A new recent LOW in GLD will turn the signal GREEN.
Rate Signal YELLOW with a Bearish short term 10 Year Yield Trend. Lower highs, lower lows make a Bear trend in general. Negative (one factor) for the stock market rally. Bonds are rallying. I would change the signal to RED if/when 2.621% is broken in a real way.
To Repeat: “Remember this too is a signal for a “further stock market rally” as it’s being used here. Remember “Bullish” for yields is Bearish for bonds and vice versa.
Note: I’ve updated my criteria for the equity signal for a further U.S. stock market rally to the following: GREEN = Bullish, YELLOW = Neutral, RED = Bearish.
Explanation: Note that a RED signal does not mean we should not buy. A GREEN signal does you cannot sell some exposure. It depends on what is going on in the economy and how oversold/overbought the market is at a given point whether the Bearish signal is to be sold, sold on the next bounce, etc. and whether a Bullish signal is to be bought or profits should be taken. YELLOW does not mean the end of the Bull or Bear. It means look for possible entry points within the existing trend, Bull or Bear, but preserve capital if the entry fails. Our strong intention is to buy low and sell high. By the way, I will keep showing the prior orange “Trigger lines” in the charts for now as reference points only; they have historical value for us from the post-election period.
Thank you for reading. Would you please leave your comments below where it says “Leave a Reply”… or ask a question… Pay it forward too by sending the link to MarketTiming.Blog (that link will immediately connect them to this webpage) to a relative or friend. Thanks for doing that.
Be sure to visit the website for more general investing knowledge at:
Standard Disclaimer: It’s your money and your decision as to how to invest it.
I thank Worden Brothers for the charting system I use to post these charts. If you want to know more about the charting system I use every day, go to my “Other Resources” page here: Other Resources It makes it much easier to follow along with me if you can see the charts and manipulate them on your own computer. It’s a great investment to have an excellent charting system. Check it out with a free trial at the link above.
Finally: Excuse and report all typos if you are so moved. I do my best to pick up most of them, but can’t find them all. Shoot me a comment (I don’t have to post the comment as I filter them, but I’ll be grateful to you!)
Copyright © 2018 By Wall Street Sun and Storm Report, LLC All rights reserved.

Thank you David! The “sell the bounce” talk among traders appears to keep the markets in a trading range with the 200 day MA as support. Yes, I agree the 200 day MA needs to hold. I’m staying with Passive Shorting as I maintain a high case position for that purpose and I will preserve profits on any bounce. This market can break badly so I don’t want to ride it down. I bought on Friday low and will buy more if the market grinds higher but with the huge moves up and down I’m selling at resistance levels even if I miss further profits. I expect the market will break the 200 day MA SPX and it could be challenging to hang around in stocks.
Sounds like a plan! I’d recommend you Write down the % of investable assets you will allocate to bounces, and how much you will sell on bounces, so you can execute a plan that you can live with.