A Market Timing Report based on the 07-06-2018 Close, published Saturday, July 7th, 2018…
I deliver focused comments on market timing once or twice a week. These are supplemented with daily “Tweets/StockTwits” (see links below).
1. SP500 Index Market Timing (S&P 500 Index®; SPY, SPX): Let’s check in on two signals we’ve been following:
“Intel-igent Signal”: Negative. The current move looks like a bounce in a downtrend. Intel’s price must move back above 54.36 to negate the sell signal. The inflection point is 54.36, and the close Friday was 51.37. INTC is our “tell” on 2nd half earnings in tech as noted HERE. Earnings start on July 10th as mentioned last week with several big banks reporting on July 13th.
Bank of America (BAC) Signal: Negative. Even dead animals bounce, so they say, but BAC did not bounce, even after the Fed cleared them for big dividend payments and buybacks. The BAC low in Feb. was 29.13 and the close Friday was 28.03, just below the close of last Friday of 28.19. The failure of a rally after the announcement higher dividends and buybacks would be allowed at the big banks by the Federal Reserve makes it even more negative. This poor behavior of financials, as I’ve said, indicates a poor prognosis for the economic recovery in the U.S. as slowly rising rates are expected, not the falling rates we’ve seen of late. Even if inflation ticks up a bit more, it could be transient, as the rest of the world slows with only a few exceptions worldwide.
Last week I outlined two possible outcomes in the near term.
First Option: We descend in an A (down) – B (consolidation) – C (down) fashion with C ending at worst at the orange line in the chart below that represents the base of the 2017 channel. Other choices include the 200 day moving average or the May 29 low. I would prefer to see the May 29th low hold. I also said: “The trend will remain intact as long as the orange up trend line is held or if 2594.62 holds, which is the May 3rd low.”
Second Option: This option has prevailed for now, the No C Wave Option (Down Wave – Consolidation – Up Wave): The 2698.67 initial low of the current consolidation, which was tested twice with slight breaches, could be challenged again, but no more. 2691.99 would have to hold at worst.” 2698.55 was the re-challenge low reached on July 2nd. And then the SP500 Index bounced on cue.
I added small cap exposure near the first recent low, which has worked out well thus far. You have to “buy fear” if you want to beat the market, and unfortunately, after your first buy, you sometimes are forced to “buy fear” at even lower levels!
Despite the Trump Trade War risk, the market chose to ignore it as what I’ve called “sloppy public trade negotiation” that will pass, though it could take a while and provide further buying opportunities.
What I’m concerned about is the infection of the U.S. economy by foreign economic illness (deceleration of growth), which would only be worsened by a real trade war. Remember: Lower growth means lower profit growth, which in turn means lower stock prices based on the falling return generated by stocks.
I have cash available, but may choose to raise more or at least rotate more exposure out of the SP500 Index and into higher yield (REITs as mentioned on social media are leading since the May 3rd low (VNQ)) and defensive positions like healthcare and bonds. I share my exposure level changes, when they are significant, on social media (links below).
The SP500 Index trend now? I consider it Bullish again, as we’ve just seen a higher low, and the price is moving up above the middle of the 2017 channel (orange lines on the chart below…).
This move must keep going obviously, or there will be a reversal at a right shoulder of a head and shoulders formation, which could return us back to the prior lows. Right – not good! Please stay tuned at the social media links below, because summers are long, and dip opportunities may abound in the midst of Presidential tweets! Love him or not, he and his administration move the markets.
Keep up-to-date during the week at Twitter and StockTwits (links below), where a combined 33,568 people are joining in…
Follow Me on Twitter® Follow Me on StockTwits®.
SP500 Large Cap Index (click chart to enlarge; SPX, SPY):
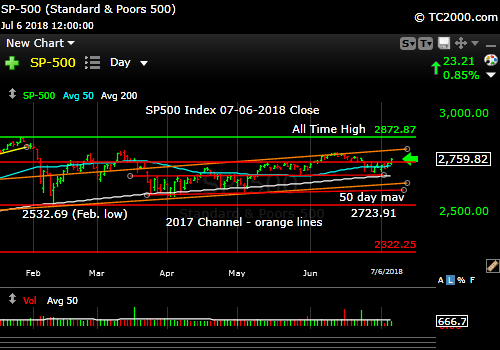
Moving up in the upward channel. That’s called an UP trend!
Survey Says! Sentiment of individual investors (AAII.com) showed a Bull minus Bear percentage spread of -11.42% vs. -12.25 the prior week. It barely budged. No change from my view last week, which you can see by scrolling down to it HERE.
| AAII.Com Individual Investor Sentiment Poll | ||
| Bulls | Neutrals | Bears |
| 27.86% | 32.87% | 39.28% |
| Thurs. 12 am CT close to poll | ||
2. U.S. Small Caps Market Timing (IWM): U.S. Small caps continue to lead large caps. Mid caps are doing better than large caps, but small caps take the prize. Note the similar location within the upward channel vs. the large caps. The out-performance could continue with the tariff battles and the strong U.S. dollar. The latter should become more pronounced as assets are relocated to the U.S. from weaker economies around the world.
Russell 2000 U.S. Small Cap Index (click chart to enlarge; IWM, RUT):
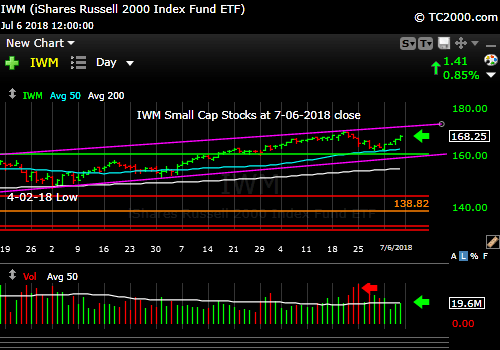
Small cap trend still strong and intact.
3. Gold Market Timing (GLD): Gold should rally once the Federal Reserve reverses course and becomes marginally more dovish, OR if panic ensues abroad as emerging markets collapse further. Panic can drive gold and the U.S. dollar up at the same time.
The Gold ETF (click chart to enlarge the chart; GLD):
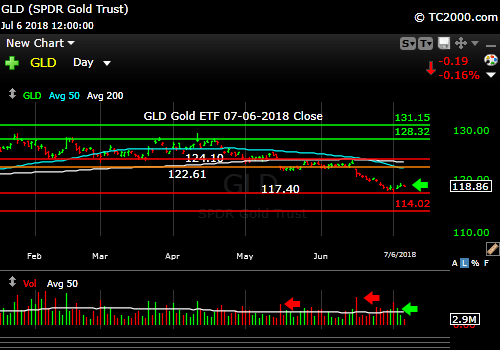
Gold won’t turn in a meaningful way until rates fall harder after inflation peaks and falls OR unless panic breaks out abroad.
4. Interest Rate Market Timing – U.S. 10 Year Treasury Note Yield (TNX): It may be safe to hold bonds for a while, although a bit more rate upside risk (within the yield down trend) remains, as inflation peaks in the coming months. Accumulating REITs has worked, and in fact TLT just broke out to a new recent high on Friday. Follow the trend. Although I am calling the overall 10 Year rate trend “Neutral,” the immediate trend is down, off a lower high. (see further comment on rates below…)
U.S. 10 Year Treasury Note Yield (click chart to enlarge; TNX, IEF, TYX,TLT,TBF):
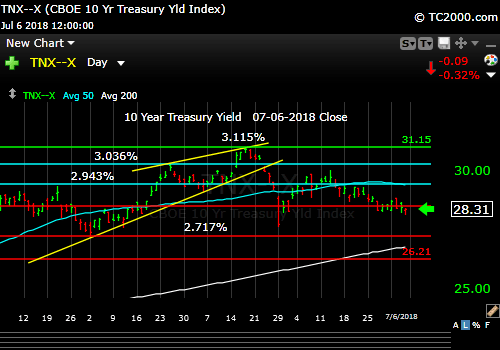
the 10 year yield is neutral overall, but currently in decline.
Now let’s review three key market timing signals together….
Do not use these signals as a trading plan. They are rough guidelines. I currently share my own moves on social media (links above).
MY SIGNAL AND TREND SUMMARY for a Further U.S. Stock Market Rally with Real GDP Growth (“real” means above inflation):
Stock Signal GREEN for a further U.S. stock market rally with a Bullish SP500 Index trend. GREEN because the IWM up trend is still intact, as I originated this signal with small caps. The small caps are a better indicator of the health of the economy, as they are most vulnerable to economic changes. The VIX closed Friday at 13.37, flirting with the key 13.31 number I have pointed out. The Bulls must quickly take out the 13.31 target to succeed from here.
Gold Signal GREEN for a further U.S. stock market rally with a BEARISH Gold Trend.
Remember GLD is being used as an indicator for the ECONOMY here.
Rate Signal YELLOW for a further stock market rally with a NEUTRAL 10 Year Yield Trend. Things have changed due to the recent swoon and then bounce in rates. A more definitive rise above 3.036% would turn the rate trend back to Bullish (bearish for bonds). A fall below 2.717% would be required to turn the rate trend back to Bearish. “Bullish” for yields is Bearish for bonds and vice versa. This level of the 10 Year Treasury Yield, which is too high for current conditions as explained HERE, will eventually slow the economy. The market seems to have adjusted to rates of up to 3% or so as said in the signal summary HERE.
Note: I’ve updated my criteria for the equity signal for a further U.S. stock market rally to the following: GREEN = Bullish, YELLOW = Neutral, RED = Bearish. In other words, the colors tell you whether the signal supports the stock rally or not, while the Bullish, Neutral, and Bearish designations are about the trend.
NOTE: A BEARISH trend signal does not mean we should not buy. A BULLISH trend signal does not mean you cannot sell some exposure. It depends on what is going on in the economy and how oversold/overbought the market is at a given point whether the Bearish signal is to be sold, sold on the next bounce, etc. and whether a Bullish signal is to be bought or if profits should be taken. A NEUTRAL trend signal does not mean the end of the Bull or Bear. It means to wait and look for possible subsequent entry points within the existing trend, Bull or Bear, but preserve capital if the entry fails. Our strong intention is to buy low and sell high. By the way, I will keep showing the prior orange “Trigger lines” in the charts for now as reference points only; they have historical value for us from the post-2016 election period.
Thank you for reading. Would you please leave your comments below where it says “Leave a Reply”… or ask a question… Pay it forward too by sending the link to MarketTiming.Blog (that link will immediately connect them to this webpage) to a relative or friend. Thanks for doing that.
Be sure to visit the website for more general investing knowledge at:
Standard Disclaimer: It’s your money and your decision as to how to invest it.
I thank Worden Brothers for the charting system I use to post these charts. If you want to know more about the charting system I use every day, go to my “Other Resources” page here: Other Resources It makes it much easier to follow along with me if you can see the charts and manipulate them on your own computer. It’s a great investment to have an excellent charting system. Check it out with a free trial at the link above.
Finally: Excuse and report all typos if you are so moved. I do my best to pick up most of them, but have not always found them all. Shoot me a comment (I don’t have to post your typo report as I filter them before publication, but I’ll be grateful to you!)
Copyright © 2018 By Wall Street Sun and Storm Report, LLC All rights reserved.
