A Market Timing Report based on the 07-13-2018 Close, published Sunday, July 15th, 2018…
I deliver focused comments on market timing once or twice a week. These are supplemented with daily “Tweets/StockTwits” (see links below).
1. SP500 Index Market Timing (S&P 500 Index®; SPY, SPX): Let’s check in on two signals we’ve been following:
“Intel-igent Market Timing Signal”: Negative. As said, Intel’s price must move back up and close above 54.36 to negate the sell signal. INTC is our “tell” on 2nd half earnings in tech as noted HERE. Earnings will be out for Intel on July 26th per NASDAQ. You should check the earnings dates for all your individual stock holdings by typing “INTC earnings,” or whatever the symbol, into Google. Recheck the date a week before earnings to be sure they have not changed it.
Be prepared to exit stocks that project weak earnings going forward, unless you still consider them great long term investments despite hick-ups. Realize though even Berkshire Hathaway’s stock has had multiple 50% pullbacks during Warren Buffett’s tenure. The last pullback like that was from late 2007 to 2009. BRKA and BRKB are just above their Feb. lows as financials have been week. Speaking of which…
Bank of America (BAC) Market Timing Signal: Negative. The stock briefly tested above the Feb. low of 29.13 and then failed. It closed at 28.55 on Friday. The inability of bank stocks to rally off of massive dividend and share buybacks is striking and a warning sign about where U.S. interest rates are headed. (see below for more discussion)
The SP500 Index at Friday’s close stopped JUST BELOW the March high of 2801.90 at 2801.31. We have a re-topping at a prior higher low. Turning down from here in a significant way would be negative, but we’ll have to see where earnings take us. Forward guidance into the second half of the year when we can expect Ex-U.S. global slowing to catch up with U.S. multinationals will be the key to achieving gains vs. losses over the next few months.
Keep up-to-date during the week at Twitter and StockTwits (links below), where a combined 33,560 people are joining in…
Follow Me on Twitter® Follow Me on StockTwits®.
SP500 Large Cap Index (click chart to enlarge; SPX, SPY): Stopped JUST below the March high of 2801.90.
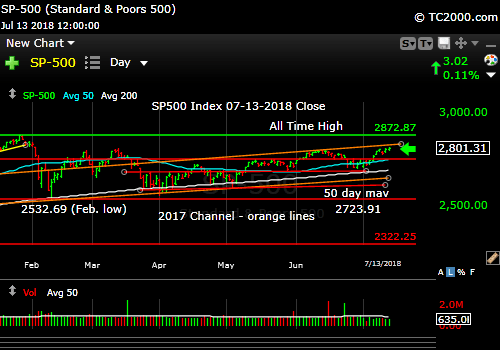
SP500 edges up toward top of the 2017 channel range.
Survey Says! Sentiment of individual investors (AAII.com) showed a Bull minus Bear percentage spread of +13.90% vs. -11.42% last week. This changes little as it’s not at an extreme. There is plenty of room to become more Bullish or Bearish.
| AAII.Com Individual Investor Sentiment Poll | ||
| Bulls | Neutrals | Bears |
| 43.05% | 27.80% | 29.15% |
| Thurs. 12 am CT close to poll | ||
2. U.S. Small Caps Market Timing (IWM): U.S. Small caps are leading large since the May 29th low, whereas mid caps are just barely ahead of large; however, since the June 27th low, large caps lead mid caps, which barely lead small caps. We will have to closely watch for further deterioration of small cap leadership. Small caps need to resume their gains soon. They are still mid-channel (magenta lines), so there is no major directional change to be seen quite yet.
Russell 2000 U.S. Small Cap Index (click chart to enlarge; IWM, RUT):

Small cap lead has been dissipating since the end of June.
3. Gold Market Timing (GLD): My comments from LAST WEEK should suffice here. Gold is back down testing a major low.
The Gold ETF (click chart to enlarge the chart; GLD):
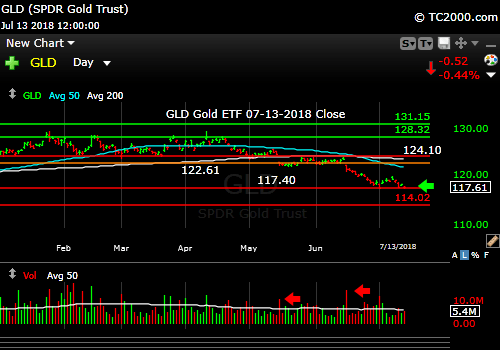
Gold back down testing a big low.
4. Interest Rate Market Timing – U.S. 10 Year Treasury Note Yield (TNX): Stuck in neutral but susceptible to being thrashed around within the range based on inflation numbers, which are slated to heat up a bit more this summer before declining once again. See my prior comments under Section#4 HERE.
U.S. 10 Year Treasury Note Yield (click chart to enlarge; TNX, IEF, TYX,TLT,TBF):

Rates stay in range. May react with upswing on inflation data over the next few months.
Now let’s review three key market timing signals together….
Do not use these signals as a trading plan. They are rough guidelines. I currently share my own moves on social media (links above).
MY SIGNAL AND TREND SUMMARY for a Further U.S. Stock Market Rally with Real GDP Growth (“real” means above inflation):
Stock Signal GREEN for a further U.S. stock market rally with a Bullish SP500 Index trend. GREEN because the IWM up trend is still intact, as I originated this signal with small caps. The small caps are a better indicator of the health of the economy, as they are most vulnerable to economic changes. The VIX closed Friday at 12.18, below the key 13.31 number I have pointed out. There is room for the VIX to fall to the sub-10 level, but earnings growth projections will allow that or NOT.
Gold Signal GREEN for a further U.S. stock market rally with a BEARISH Gold Trend.
Remember GLD is being used as an indicator for the ECONOMY here.
Rate Signal YELLOW for a further stock market rally with a NEUTRAL 10 Year Yield Trend. Close Friday was 2.831%. Things have changed due to the recent swoon and then bounce in rates. A more definitive rise above 3.036% would turn the rate trend back to Bullish (bearish for bonds). A fall below 2.717% would be required to turn the rate trend back to Bearish. “Bullish” for yields is Bearish for bonds and vice versa. This level of the 10 Year Treasury Yield, which is too high for current conditions as explained HERE, could eventually slow the economy. The market seems to have adjusted to rates of up to 3% or so as said in the signal summary HERE.
Note: I’ve updated my criteria for the equity signal for a further U.S. stock market rally to the following: GREEN = Bullish, YELLOW = Neutral, RED = Bearish. In other words, the colors tell you whether the signal supports the stock rally or not, while the Bullish, Neutral, and Bearish designations are about the trend.
NOTE: A BEARISH trend signal does not mean we should not buy. A BULLISH trend signal does not mean you cannot sell some exposure. It depends on what is going on in the economy and how oversold/overbought the market is at a given point whether the Bearish signal is to be sold, sold on the next bounce, etc. and whether a Bullish signal is to be bought or if profits should be taken. A NEUTRAL trend signal does not mean the end of the Bull or Bear. It means to wait and look for possible subsequent entry points within the existing trend, Bull or Bear, but preserve capital if the entry fails. Our strong intention is to buy low and sell high. By the way, I will keep showing the prior orange “Trigger lines” in the charts for now as reference points only; they have historical value for us from the post-2016 election period.
Thank you for reading. Would you please leave your comments below where it says “Leave a Reply”… or ask a question… Pay it forward too by sending the link to MarketTiming.Blog (that link will immediately connect them to this webpage) to a relative or friend. Thanks for doing that.
Be sure to visit the website for more general investing knowledge at:
Standard Disclaimer: It’s your money and your decision as to how to invest it.
I thank Worden Brothers for the charting system I use to post these charts. If you want to know more about the charting system I use every day, go to my “Other Resources” page here: Other Resources It makes it much easier to follow along with me if you can see the charts and manipulate them on your own computer. It’s a great investment to have an excellent charting system. Check it out with a free trial at the link above.
Finally: Excuse and report all typos if you are so moved. I do my best to pick up most of them, but have not always found them all. Shoot me a comment (I don’t have to post your typo report as I filter them before publication, but I’ll be grateful to you!)
Copyright © 2018 By Wall Street Sun and Storm Report, LLC All rights reserved.
