A Market Timing Report based on the 07-20-2018 Close, published Sunday, July 22nd, 2018…
I deliver focused comments on market timing once or twice a week. These are supplemented with daily “Tweets/StockTwits” (see links below).
1. SP500 Index Market Timing (S&P 500 Index®; SPY, SPX): Let’s check in on two signals we’ve been following:
“Intel-igent Market Timing Signal”: Negative. It’s forming a lower high in fact. As said, Intel’s price must move back up and close above 54.36 to negate the sell signal. INTC is our “tell” on 2nd half earnings in tech as noted HERE. Earnings will be out for Intel on Thursday, July 26th per NASDAQ.
Bank of America (BAC) Market Timing Signal: Positive, although it is too early to know if it’s sustainable. The stock closed at 30.13 on Friday above the Feb. low. For now, this is a positive reversal. The XLF is about at its down trend line and must move higher to create a buy signal. This may just be a rally that will last a quarter or two, as interest rates should push down to the lower end of their range while the global economy decelerates and drags the U.S. down with it as we enter Q4 2018 to Q1 2019. You will note below that the immediate rate trend is UP, which could create this rally for the financials, however short it is.
SP500 Earnings Season is coming in very well with about 17% of the SPX reporting to date.
Last week I said: “The SP500 Index at Friday’s close stopped JUST BELOW the March high of 2801.90 at 2801.31. We have a re-topping at a prior higher low.” This week the close was at 2801.83 – it is less than a point higher than it was last Friday! Since earnings really began in earnest with bank earnings on Friday the 13th, the market has gone nowhere based on the very positive results cited by FactSet:
“Earnings Scorecard: For Q2 2018 (with 17% of the companies in the S&P 500 reporting actual results for the quarter), 87% of S&P 500 companies have reported a positive EPS surprise and 77% have reported a positive sales surprise.” See the actual earnings and revenue growth at the PDF link below.
What we’re more interested in are the forward projections:
FactSet says (from PDF link HERE):
For Q3 2018, analysts are projecting earnings growth of 21.6% and revenue growth of 7.5%.
For Q4 2018, analysts are projecting earnings growth of 18.0% and revenue growth of 5.7%.
For Q1 2019, analysts are projecting earnings growth of 7.1% and revenue growth of 5.5%.
For Q2 2019, analysts are projecting earnings growth of 10.4% and revenue growth of 4.7%.
Note that Q3 2018, which ends Sept. 30th and will be reported in October, at the moment represents a slight acceleration of earnings from current levels based on reports to date (read the PDF at link above), but earnings and revenues are projected to materially slow as we enter Q4 2018 and Q1 2019.
When the market will begin discounting this in a big way is an unknown as is the extent of the draw-down, but the lower growth projections, as I’ve been saying for weeks, must naturally lead to some adjustment of stock prices to the downside. We are talking about a drop of more than HALF in the prior earnings growth rate.
The general assumption is that markets run 6 months ahead of the data going south. Q4 2018 earnings are reported in January 2019 6 months from now, so by that rule, the market should decline starting…now.
Remember too that the boost in earnings we are seeing is based on “Fiscal” maneuvers meaning the Trump/GOP corporate and individual tax cuts and repatriation of foreign cash holdings of corporations. Those don’t add to GROWTH of earnings going forward unless the money is used to increase revenues and earnings! Stock buybacks and dividends don’t do that. They provide a one time boost to earnings, which per FactSet has helped to offset increased costs due to inflation.
An unanswered research question is this “How much of the tax cut money will be successfully invested in new growth and how much will just go into shareholder pockets, employee pockets (many of whom are deserving of long awaited wage increases), and foolish expansion decisions/buyouts of competitors etc.?
Time has commented HERE on this issue claiming a combined 56% is going to workers (13%) and investors (43%) based on a Morgan Stanley survey, so the rest could presumably just be kept aside OR used to increase investments in the United States. The tax law, however, does not tell companies they must invest the funds in the U.S.
America First? Not necessarily given the poorly written tax law that should have said, for example, that repatriated funds MUST be invested within the United States!
Realize there is a time lag in the investment of the tax cut bump in earnings. What if it takes 12 months for most companies to deploy the cash in new and profitable ventures? That means the earnings growth FROM the boost in earnings in the 2018 quarters could filter through to provide growth into 2019 to offset some of the global deceleration.
In the meantime, the SP500 Index closed just below a major LOWER high, while BOTH mid caps (IJH) and small caps (IWM) closed just below all time highs.
For IJH, it is the prior end of Jan. high and for IWM the more recent and higher June and July highs that are the big test.
On a practical level, due to this teetering of all 3 indexes at major highs, I decreased my equity exposure as a percentage of my maximum Bullish exposure by 5% or so this past week by selling small caps (that means if your allocation is 60%, you would lower it by 3%). Overall I’m at about 86% of usual maximum equity exposure worldwide, highly concentrated in the leader – the U.S.
I may have been early on that move to raise cash, but I’m willing to add back more equity exposure if I am wrong, and the pivot is UP rather than down from here. The percent exposure I have tells you this is a tactical trading move, not one that says “the market is going into a protracted Bear Market.” If that’s what shows up, you’ll see my exposure drop much more dramatically.
Still, the next move could be down 10% or more (a “Mini Bear”) without turning the market into a Big Bear as I’ve defined it HERE.
Keep up-to-date during the week at Twitter and StockTwits (links below), where a combined 33,573 people are joining in…
Follow Me on Twitter® Follow Me on StockTwits®.
SP500 Large Cap Index (click chart to enlarge; SPX, SPY): Stopped AGAIN JUST below the March high of 2801.90. Note also that the price is close to the 2017 (orange lines) channel high.
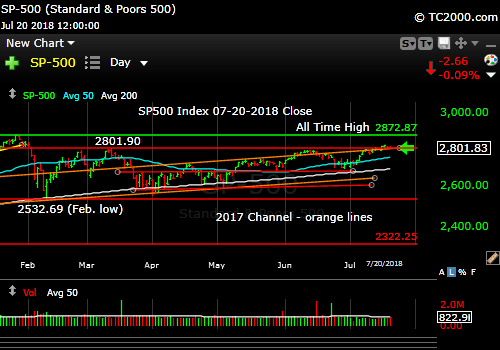
Pivot time! Follow the move, up or down.
Survey Says! Sentiment of individual investors (AAII.com) showed a Bull minus Bear percentage spread of +9.72% vs. +13.90% last week. Once again, there is plenty of room to become more Bullish or Bearish. Not much help in my view. One catch… The Neutral Rate by itself is predictive of higher stock prices out 6 months with a probability of about 80% per AAII research on their own data. This is a reason NOT to get overly Bearish. This is just ONE factor I consider of course, and the ultimate arbiter is THE MARKET!
| AAII.Com Individual Investor Sentiment Poll | ||
| Bulls | Neutrals | Bears |
| 34.66% | 40.40% | 24.94% |
| Thurs. 12 am CT close to poll | ||
2. U.S. Small Caps Market Timing (IWM): Small caps are still under-performing large caps by a bit, which they should not in a raging Bull market. But they are still mid-channel (magenta lines), so there is no major directional change to be seen quite yet. More of a caution sign.
Russell 2000 U.S. Small Cap Index (click chart to enlarge; IWM, RUT):

Small caps still holding mid-channel.
3. Gold Market Timing (GLD): Gold finally did something slightly positive this past week. The volume shot up again, but a new low was not achieved based on that volume. The next test is to create a reversal above the Dec. low shown in the chart below…
The reversal may in fact happen. As the market begins to see how the Fed will have to go into neutral at best in the coming months, unless inflation persistently rises, the U.S dollar will fall with interest rates, and gold will rise.
The Gold ETF (click chart to enlarge the chart; GLD):

Gold must reverse above that Dec. 2017 low.
4. Interest Rate Market Timing – U.S. 10 Year Treasury Note Yield (TNX): The immediate rate trend is now UP. The intermediate trend as summarized in the “Signal” list below, is neutral. Inflation is set to peak sometime this quarter, so rates could rise for a bit and then resume their decline. That means financials are a trade, not a hold!
U.S. 10 Year Treasury Note Yield (click chart to enlarge; TNX, IEF, TYX,TLT,TBF):
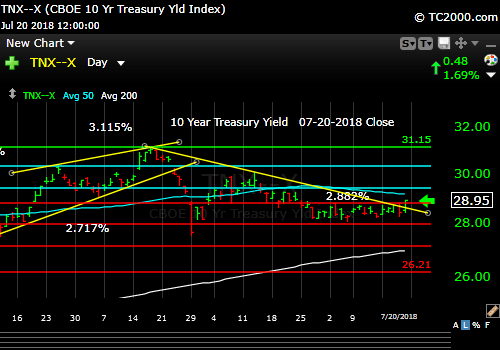
Immediate trend is UP, but intermediate trend is neutral.
Now let’s review three key market timing signals together….
Do not use these signals as a trading plan. They are rough guidelines. I currently share my own moves on social media (links above).
MY SIGNAL AND TREND SUMMARY for a Further U.S. Stock Market Rally with Real GDP Growth (“real” means above inflation):
Stock Signal GREEN for a further U.S. stock market rally with a Bullish SP500 Index trend. GREEN because the IWM up trend is still intact, as I originated this signal with small caps. The small caps are a better indicator of the health of the economy, as they are most vulnerable to economic changes. The VIX closed Friday at 12.86 higher than the 12.18 close last Friday, but below the key 13.31 number I have pointed out. There is room for the VIX to fall to the sub-10 level, but earnings growth projections will allow that or NOT.
Gold Signal GREEN for a further U.S. stock market rally with a BEARISH Gold Trend. There is an opportunity for at least a short term rally as noted above.
Remember GLD is being used as an indicator for the ECONOMY here.
Rate Signal YELLOW for a further stock market rally with a NEUTRAL 10 Year Yield Trend. The immediate trend is UP however as noted above. Close Friday was 2.895%.
As said before (note top trigger changed to 3.035%): “A more definitive rise above 3.035% would turn the rate trend back to Bullish (bearish for bonds). A fall below 2.717% would be required to turn the rate trend back to Bearish. “Bullish” for yields is Bearish for bonds and vice versa. This level of the 10 Year Treasury Yield, which is too high for current conditions as explained HERE, could eventually slow the economy. The market seems to have adjusted to rates of up to 3% or so as said in the signal summary HERE.”
Note: I’ve updated my criteria for the equity signal for a further U.S. stock market rally to the following: GREEN = Bullish, YELLOW = Neutral, RED = Bearish. In other words, the colors tell you whether the signal supports the stock rally or not, while the Bullish, Neutral, and Bearish designations are about the trend.
NOTE: A BEARISH trend signal does not mean we should not buy. A BULLISH trend signal does not mean you cannot sell some exposure. It depends on what is going on in the economy and how oversold/overbought the market is at a given point whether the Bearish signal is to be sold, sold on the next bounce, etc. and whether a Bullish signal is to be bought or if profits should be taken. A NEUTRAL trend signal does not mean the end of the Bull or Bear. It means to wait and look for possible subsequent entry points within the existing trend, Bull or Bear, but preserve capital if the entry fails. Our strong intention is to buy low and sell high. By the way, I will keep showing the prior orange “Trigger lines” in the charts for now as reference points only; they have historical value for us from the post-2016 election period.
Thank you for reading. Would you please leave your comments below where it says “Leave a Reply”… or ask a question… Pay it forward too by sending the link to MarketTiming.Blog (that link will immediately connect them to this webpage) to a relative or friend. Thanks for doing that.
Be sure to visit the website for more general investing knowledge at:
Standard Disclaimer: It’s your money and your decision as to how to invest it.
I thank Worden Brothers for the charting system I use to post these charts. If you want to know more about the charting system I use every day, go to my “Other Resources” page here: Other Resources It makes it much easier to follow along with me if you can see the charts and manipulate them on your own computer. It’s a great investment to have an excellent charting system. Check it out with a free trial at the link above.
Finally: Excuse and report all typos if you are so moved. I do my best to pick up most of them, but have not always found them all. Shoot me a comment (I don’t have to post your typo report as I filter them before publication, but I’ll be grateful to you!)
Copyright © 2018 By Wall Street Sun and Storm Report, LLC All rights reserved.
