A Market Timing Report based on the 07-27-2018 Close, published Sunday, July 29th, 2018…
I deliver focused comments on market timing once or twice a week. These are supplemented with daily “Tweets/StockTwits” (see links below).
1. SP500 Index Market Timing (S&P 500 Index®; SPY, SPX):
The U.S. small and mid caps peaked and fell off their respective market timing peaks, both closing below their respective 50 day moving averages on a negative day following very strong GDP results (still falling short of the GDP Q/Q SAAR peak of 2014, which was above 5%; the GDP charts are on my social media feed from Friday – see links below).
The large cap SP500 Index is in danger of breaking down through the prior breakout level of 280.41, which was the March high. If it breaks through there, and the other two indexes keep moving down, that will define a temporary top. You can see in the chart below that the SP500 is just above the 2017 Channel still, so it’s overextended vs. the prior trend with room to fall. Ideally for the Bulls the lower end of the 2017 Channel (orange lines) will hold the fall, but the problem is that is too far!
The 200 day moving average of the S&P500 has been the market’s guide from the Feb. low; whether you believe in the importance of moving averages (mav for short) or not does not matter. They are simply guides of how much a market has moved off a high in this case, but are also psychological guides at times, which is obviously what the 200 day moving average has been since February. The SPX touched the 200 day mav once, penetrated it and bounced twice and got close to it without quite reaching it the 4th time. We will have to check in on the market’s behavior if and when we get there. Remember that none of these lines matters when considered outside the context of the trading at the time the given line is reached. This process is not a once a week job!
Let’s check in on two signals we’ve been following:
“Intel-igent Market Timing Signal”: Strongly Negative. Intel broke important support on increasing volume, so there is no question, things are looking bleak for the stock. Of course, the pundits immediately say it’s all company specific, but I’d be careful and look deeper. Global growth is slowing again and that does not bode well for chip sales of any kind, product development issues and missing CEO aside. (Reminder:INTC is our “tell” on 2nd half earnings in tech as noted HERE.
Bank of America (BAC) Market Timing Signal: Remains positive, and the stock has broken out above the down trend line on the daily chart. The stock closed at 31.06 on Friday. XLF has done the same, so investors are buying into the rally in the 10 Year Treasury, which in my view is non-sustainable, at least for very long. There may be a few more months of rising inflation that can goose it, but then global deceleration should drag it back down. A close above the prior high would negate this view. I predicted this temporary burst of inflation due to the Trump sugar infusion of tax cuts would cause rates to rise somewhat and financials to rally.
SP500 Earnings Season is still coming in very well with about half of the SPX reporting to date. Review the details at this FactSet PDF: HERE.
Earnings Scorecard from the above FactSet PDF: “For Q2 2018 (with 53% of the companies in the S&P 500 reporting actual results for the quarter), 83% of S&P 500 companies have reported a positive EPS surprise and 77% have reported a positive sales surprise. If 83% is the final number, it will mark the highest percentage since FactSet began tracking this metric in Q3 2008.”
The strongest 3 sectors in earnings surprises were: Consumer Discretionary (XLY) (consumption is still strong) and Utilities (XLU) running close together and then Healthcare (XLV) closely followed by Industrials (XLI) and Telecom (XLT). Revenue surprises were modest, 1.9% at the high end in Technology (XLK) followed by Financials (XLF), Industrials (XLI), and Real Estate (XLRE).
The issue is still with the next few quarters, especially Q4 of 2018 and Q1 of 2019, which could be significantly weaker than the current numbers as I discussed last week HERE.
Keep up-to-date during the week at Twitter and StockTwits (links below)…
Follow Me on Twitter® Follow Me on StockTwits®.
SP500 Large Cap Index (click chart to enlarge; SPX, SPY):
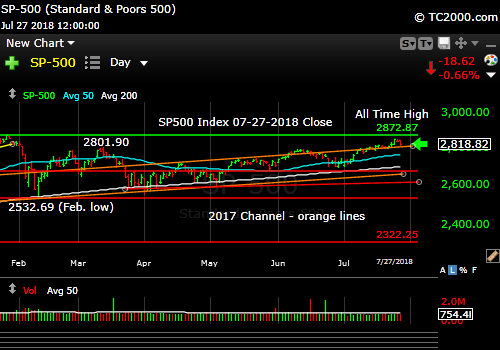
Reversal coming soon?
Survey Says! Sentiment of individual investors (AAII.com) showed a Bull minus Bear percentage spread of +4.62% from +9.72% last week. Once again, there is plenty of room to become more Bullish or Bearish. Not much help. One catch remains… The Neutral Rate by itself is predictive of higher stock prices out 6 months with a probability of about 80% per AAII research on their own data.
| AAII.Com Individual Investor Sentiment Poll | ||
| Bulls | Neutrals | Bears |
| 31.52% | 41.58% | 26.90% |
| Thurs. 12 am CT close to poll | ||
2. U.S. Small Caps Market Timing (IWM): Small caps are leading the way down off their recent top.
Russell 2000 U.S. Small Cap Index (click chart to enlarge; IWM, RUT):
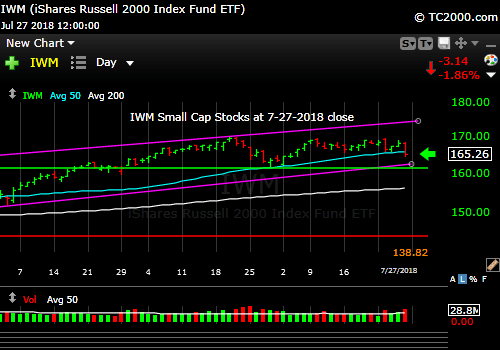
Weakness set in on about July 10th vs. the large caps.
3. Gold Market Timing (GLD): Gold is fairly flat vs. the recent low. Rates and the dollar dropping is what gold needs to revive. The only positive I see is that the last volume spike did NOT create a new low as the prior spikes did.
The Gold ETF (click chart to enlarge the chart; GLD):

Flat near the recent low.
4. Interest Rate Market Timing – U.S. 10 Year Treasury Note Yield (TNX): You see on the chart below that we have the potential of a lower high here. If the rise of inflation persists for a few more months, rates will move even higher, but are not likely to top the prior high. If you are betting on this move in rates by buying financials, be prepared to exit when global deceleration infects the U.S economy going into Q4 2018 or Q1 2019 or on falling interest rates.
U.S. 10 Year Treasury Note Yield (click chart to enlarge; TNX, IEF, TYX,TLT,TBF):
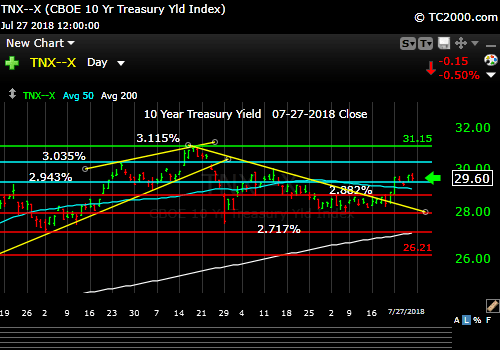
Rates making another lower high or will inflation persist longer?
Now let’s review three key market timing signals together….
Do not use these signals as a trading plan. They are rough guidelines. I currently share my own moves on social media (links above).
MY SIGNAL AND TREND SUMMARY for a Further U.S. Stock Market Rally with Real GDP Growth (“real” means above inflation):
Stock Signal RED for a further U.S. stock market rally with a Bullish SP500 Index trend. RED because the IWM trend is down, as I originated this signal with small caps. I’m being a little aggressive with this call, but we’re off a prior top and down from a lower high. The small caps are a better indicator of the health of the economy, as they are most vulnerable to economic changes. The VIX closed Friday at 13.03 barely higher than the 12.86 close last Friday, but below the key 13.31 number I have pointed out. There is room for the VIX to fall to the sub-10 level. We should have a “decision” in the SP500 Index this week as to which way it will pivot. I was correct so far to sell small caps, but let’s see what the large caps do now.
Gold Signal GREEN for a further U.S. stock market rally with a BEARISH Gold Trend. There is an opportunity for at least a short term rally as noted above.
Remember GLD is being used as an indicator for the ECONOMY here.
Rate Signal YELLOW for a further stock market rally with a NEUTRAL 10 Year Yield Trend. Close Friday was 2.960%.
As said before (note top trigger changed to 3.035%): “A more definitive rise above 3.035% would turn the rate trend back to Bullish (bearish for bonds). A fall below 2.717% would be required to turn the rate trend back to Bearish. “Bullish” for yields is Bearish for bonds and vice versa. This level of the 10 Year Treasury Yield, which is too high for current conditions as explained HERE, could eventually slow the economy. The market seems to have adjusted to rates of up to 3% or so as said in the signal summary HERE.”
Note: I’ve updated my criteria for the equity signal for a further U.S. stock market rally to the following: GREEN = Bullish, YELLOW = Neutral, RED = Bearish. In other words, the colors tell you whether the signal supports the stock rally or not, while the Bullish, Neutral, and Bearish designations are about the trend.
NOTE: A BEARISH trend signal does not mean we should not buy. A BULLISH trend signal does not mean you cannot sell some exposure. It depends on what is going on in the economy and how oversold/overbought the market is at a given point whether the Bearish signal is to be sold, sold on the next bounce, etc. and whether a Bullish signal is to be bought or if profits should be taken. A NEUTRAL trend signal does not mean the end of the Bull or Bear. It means to wait and look for possible subsequent entry points within the existing trend, Bull or Bear, but preserve capital if the entry fails. Our strong intention is to buy low and sell high. By the way, I will keep showing the prior orange “Trigger lines” in the charts for now as reference points only; they have historical value for us from the post-2016 election period.
Thank you for reading. Would you please leave your comments below where it says “Leave a Reply”… or ask a question… Pay it forward too by sending the link to MarketTiming.Blog (that link will immediately connect them to this webpage) to a relative or friend. Thanks for doing that.
Be sure to visit the website for more general investing knowledge at:
Standard Disclaimer: It’s your money and your decision as to how to invest it.
I thank Worden Brothers for the charting system I use to post these charts. If you want to know more about the charting system I use every day, go to my “Other Resources” page here: Other Resources It makes it much easier to follow along with me if you can see the charts and manipulate them on your own computer. It’s a great investment to have an excellent charting system. Check it out with a free trial at the link above.
Finally: Excuse and report all typos if you are so moved. I do my best to pick up most of them, but have not always found them all. Shoot me a comment (I don’t have to post your typo report as I filter them before publication, but I’ll be grateful to you!)
Copyright © 2018 By Wall Street Sun and Storm Report, LLC All rights reserved.
