A Market Timing Report based on the 08-03-2018 Close, published Sunday, August 5, 2018…
I deliver focused comments on market timing once or twice a week. These are supplemented with daily “Tweets/StockTwits” (see links below).
1. SP500 Index Market Timing (S&P 500 Index®; SPY, SPX):
U.S. small caps are still struggling, sitting just above their 50 day moving average as you can see in the second chart below. Remember, we don’t use these moving averages as trading signals generally, just reference points for strength vs. weakness.
Mid caps rose and are just below an important prior high of 199.91 for IJH, closing at 199.75. That’s called re-topping.
The large cap SP500 Index ETF SPY tested below 280.41, which was the March high, and has since recovered. Along with this recovery, the VIX dove below our key target (13.31). Despite that, you can see in the chart the SP500 is above the 2017 Channel still, so it’s STILL overextended vs. the prior trend, which raises the risk should you be adding at this point. The trend is still Bullish, however, and UP for the large caps.
Let’s check in on two signals we’ve been following:
“Intel-igent Market Timing Signal”: Strongly Negative. It has bounced without any real conviction to just above the 200 day moving average. Great company now without a permanent CEO and facing global deceleration as a multinational.(Reminder: INTC is our “tell” on 2nd half earnings in tech as noted HERE.
Bank of America (BAC) Market Timing Signal: Remains positive, and the stock has broken out above the down trend line on the daily chart as mentioned last week. Don’t bet on it keeping up with SPY though, as rates are coming back down, AND the economy is slated to slow in Q4 and further into Q1 and Q2 of 2019.
SP500 Earnings Season is still coming in very well with 81% of the SPX reporting to date. Review the details at this FactSet PDF: HERE.
Earnings Scorecard from the above FactSet PDF:
What were the SPX sectors with earnings surprises above expectations in Q2? Telecom, Health Care, Tech, and Consumer Staples all had over 90% positive surprises.
What we really want to focus on is the FUTURE, not the past:
Earnings expectations fell from THESE numbers 2 weeks ago:
For Q3 2018, analysts are projecting earnings growth of 21.6% and revenue growth of 7.5%.
For Q4 2018, analysts are projecting earnings growth of 18.0% and revenue growth of 5.7%.
For Q1 2019, analysts are projecting earnings growth of 7.1% and revenue growth of 5.5%.
For Q2 2019, analysts are projecting earnings growth of 10.4% and revenue growth of 4.7%.
…to these updated numbers as of Friday per FactSet. Note the slowing beginning in Q4 and deepening into Q1 and Q2 of 2019. Q1 of 2019 is a bit stronger, while Q2 is weaker:
For Q3 2018, analysts are projecting earnings growth of 20.7% and revenue growth of 7.7%.
For Q4 2018, analysts are projecting earnings growth of 17.8% and revenue growth of 6.0%.
For Q1 2019, analysts are projecting earnings growth of 7.3% and revenue growth of 6.2%.
For Q2 2019, analysts are projecting earnings growth of 8.2% and revenue growth of 4.6%.
Lower E, means lower P, so the markets will have a reason to moderate their pace and likely correct between now and Q1 and Q2 of 2019. The revenue GROWTH RATE decline between Q3 2018 and Q2 2019 is projected to be 42% from the numbers above! That is big.
Earnings growth for the SP500 is 24% (year over year comparison for the 2nd Quarter) as of the last look by FactSet, which means that even by Q4, the earnings GROWTH RATE will be down by 25.8%! This comparison, because it’s still within the same tax year, avoids the impact of losing the tax benefits for 2018 vs. 2017 in earnings. The coming weakness in both revenues and earnings growth rates may be why the even more economically sensitive small caps are already weakening as they have since their all time high vs. the large caps on 6-20-2018.
Finally, note another measure of risk built into the market currently. See the labeled up trend lines 1 (green), 2 (yellow), and 3 (green), each one steeper than the prior? Line 1 lines up with the Feb. low by the way (off the chart to the left). This means the market is accelerating its upswing and after acceleration comes…? Deceleration with reversion to the prior trend.
Keep up-to-date during the week at Twitter and StockTwits (links below)…
Follow Me on Twitter® Follow Me on StockTwits®.
SP500 Large Cap Index (click chart to enlarge; SPX, SPY):

Large caps still extending though in up trend.
Survey Says! Sentiment of individual investors (AAII.com) showed a Bull minus Bear percentage spread of -2.97 vs. +4.62% last week. Investors got a bit more Bearish as the large caps ROSE! This alone is Bullish for further gains in the SP500 Index.
| AAII.Com Individual Investor Sentiment Poll | ||
| Bulls | Neutrals | Bears |
| 29.11% | 38.81% | 32.08% |
| Thurs. 12 am CT close to poll | ||
2. U.S. Small Caps Market Timing (IWM): Small caps have been under-performing the SP500 Index, since their all time high on 6-20-2018. Yet, they are in the middle of a triangle. Follow the bouncing ball either way out of the triangle. Note they are just barely above the 50 day moving average of 166.38, closing at 166.39. On the positive side, they remain in their current up channel. My sense was that the negatives outweighed the positives and exited just below the Friday close on 7-16-18.
Russell 2000 U.S. Small Cap Index (click chart to enlarge; IWM, RUT):

Harbinger of economic weakness to come?
3. Gold Market Timing (GLD): The problem for gold is that it is hurt by the strong dollar. As rates decline, this may pressure the dollar enough vs. international flight to the dollar during the global economic deceleration (already happening in China and Europe, and Japan is slated to slow in Q3).
The Gold ETF (click chart to enlarge the chart; GLD):

Gold is now back testing just above the 2017 lows.
4. Interest Rate Market Timing – U.S. 10 Year Treasury Note Yield (TNX): We now have a break of the recent up trend in rates (yellow line) and a double lower top at about 3%. I bought intermediate term Treasuries on 7-31-2018 (ETF I used was IEF). If you want more gain/more risk, go longer than that (e.g. TLT).
U.S. 10 Year Treasury Note Yield (click chart to enlarge; TNX, IEF, TYX,TLT,TBF):
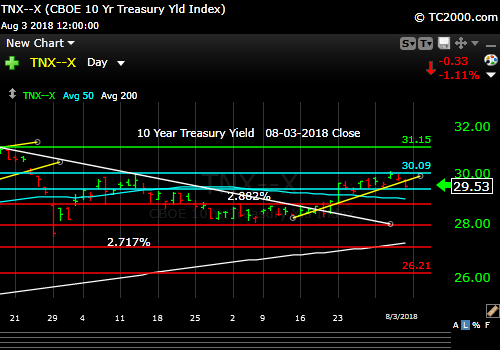
Have rates peaked once again?
Now let’s review three key market timing signals together….
Do not use these signals as a trading plan. They are rough guidelines. I currently share my own moves on social media (links above).
MY SIGNAL AND TREND SUMMARY for a Further U.S. Stock Market Rally with Real GDP Growth (“real” means above inflation):
Stock Signal NEUTRAL for a further U.S. stock market rally with a Bullish SP500 Index trend. Changed this signal, which is based on small cap performance, from Red to neutral because of the higher low just put in by the small caps (IWM) forming the triangle seen in the chart above. The small caps are a better indicator of the health of the economy, as they are most vulnerable to economic changes. The VIX closed Friday at 11.64 is Bullish. There is room for the VIX to fall to the sub-10 level. Any move back above 13.31 may indicate a developing Bearish trend. A “test” doesn’t count.
Gold Signal GREEN for a further U.S. stock market rally with a BEARISH Gold Trend. There is an opportunity for at least a short term rally as noted above.
Remember GLD is being used as an indicator for the ECONOMY here.
Rate Signal RED for a further stock market rally with a BEARISH 10 Year Yield Trend. Close Friday was 2.953% only slightly below last Fri.’s close.
This Bearish signal will be voided on a close of TNX above 3.035%. As said before: “A more definitive rise above 3.035% would turn the rate trend back to Bullish for rates (bearish for bonds). This level of the 10 Year Treasury Yield, which is too high for current conditions as explained HERE, could eventually slow the economy. The market seems to have adjusted to rates of up to 3% or so as said in the signal summary HERE.”
Note: I’ve updated my criteria for the equity signal for a further U.S. stock market rally to the following: GREEN = Bullish, YELLOW = Neutral, RED = Bearish. In other words, the colors tell you whether the signal supports the stock rally or not, while the Bullish, Neutral, and Bearish designations are about the trend.
NOTE: A BEARISH trend signal does not mean we should not buy. A BULLISH trend signal does not mean you cannot sell some exposure. It depends on what is going on in the economy and how oversold/overbought the market is at a given point whether the Bearish signal is to be sold, sold on the next bounce, etc. and whether a Bullish signal is to be bought or if profits should be taken. A NEUTRAL trend signal does not mean the end of the Bull or Bear. It means to wait and look for possible subsequent entry points within the existing trend, Bull or Bear, but preserve capital if the entry fails. Our strong intention is to buy low and sell high. By the way, I will keep showing the prior orange “Trigger lines” in the charts for now as reference points only; they have historical value for us from the post-2016 election period.
Thank you for reading. Would you please leave your comments below where it says “Leave a Reply”… or ask a question… Pay it forward too by sending the link to MarketTiming.Blog (that link will immediately connect them to this webpage) to a relative or friend. Thanks for doing that.
Be sure to visit the website for more general investing knowledge at:
Standard Disclaimer: It’s your money and your decision as to how to invest it.
I thank Worden Brothers for the charting system I use to post these charts. If you want to know more about the charting system I use every day, go to my “Other Resources” page here: Other Resources It makes it much easier to follow along with me if you can see the charts and manipulate them on your own computer. It’s a great investment to have an excellent charting system. Check it out with a free trial at the link above.
Finally: Excuse and report all typos if you are so moved. I do my best to pick up most of them, but have not always found them all. Shoot me a comment (I don’t have to post your typo report as I filter them before publication, but I’ll be grateful to you!)
Copyright © 2018 By Wall Street Sun and Storm Report, LLC All rights reserved.
