A Market Timing Report based on the 8-10-2018 Close, published Saturday, August 11, 2018…
I deliver focused comments on market timing once or twice a week. These are supplemented with daily “Tweets/StockTwits” (see links below).
1. SP500 Index Market Timing (S&P 500 Index®; SPY, SPX):
As I said last weekend, the trend is still up, but the risk level was increased and still is, as the price of the SP500 Index is above both
1. the steep up trend line (green line in chart below), which was the 3rd such line pointed out last week HERE and
2. above the 2017 up channel shown in the first chart below as two ascending orange lines.
The market failed to take out the prior all time high in the SPX, which was 2872.87. It also reversed the last breakout, which is not a deadly sin, but it weakens the momentum. The next downside targets could be any of these:
- The most recent (green) up trend line at 2818 (changes daily)
- 50 day moving average of 2784.85 (changes daily).
- 200 day moving average 2708.71 (changes daily)
- 2017 lower channel line at 2667 (changes daily)
That said, targets are useless by themselves. As I like to say, you have to see what the market is doing when you arrive at a target. That’s why you must be tuned into Twitter and StockTwits on big down days (sometimes one of them is not working, so I would join both if I were you; see social media links below. You do not have to ever Tweet if you don’t care to.
Let’s check in on two signals we’ve been following:
“Intel-igent Market Timing Signal”: Strongly Negative. Last week I said: “It has bounced without any real conviction to just above the 200 day moving average.” It fell hard on Friday on an analyst downgrade by a leading firm. Great company now without a permanent CEO and facing global deceleration as a multinational.(Reminder: INTC is our “tell” on 2nd half earnings in tech as noted HERE.
Bank of America (BAC) Market Timing Signal: Remains positive on a longer term trend basis, but on Friday on the CPI data showed inflation running about the same as it was last month (2.9% headline; however, core inflation was up though to a new recent high by 0.1% to 2.4%), and BAC broke the recent shorter term up trend as yields FELL; it even gapped down from the prior close. Again, don’t count on rising yields from here. There could be some last gasps in failed counter rallies, but rates should ease from here. That’s bad news for the U.S. economy and bad news for bank income.
SP500 Earnings Season is still coming in very well with 91% of the SPX reporting to date. Review the details at this FactSet PDF: HERE.
Please review the PDF at the link above with particular attention to the fourth from the bottom chart labeled “Trailing 12M P/E Ratio: Long-Term Averages” and “12 mo EPS vs. change in price” You can see that as the trailing 12 month EPS fell (dark blue line), the SP500 price first consolidated and then fell around the 2015 and 2016 market lows.
The market actually rose before the ultimate low in trailing 12 mo. EPS of about 109 was reached. The two major SPX lows were at EPS levels of about 111 on the chart as you see. You can also see the same thing happened at a much more extreme level during the 2008-2009 decline with the low in EPS occurring in 2010 AFTER the market began recovering in 3-2009. There was also a big drop in the market without an earnings decline during the summer of 2011. Wikipedia reminds us…
“This [2011 decline] was due to fears of contagion of the European sovereign debt crisis to Spain and Italy, as well as concerns over France’s current AAA rating, concerns over the slow economic growth of the United States and its credit rating being downgraded.” REF
In this case TTM EPS kept climbing through the period while the stock market suffered a major decline. Life is complicated, and we have to watch many macroeconomic and relevant political balls at once!
Conclusion: We know we are headed into negative earnings comparisons for Q1 and Q2 of 2019 with slight softness showing up in Q4 2018. We should expect a correction in the stock market all things being equal, just from the decline in the RATE OF EARNINGS AND REVENUES GROWTH. As I’ve said for 3 weeks, even a lower growth rate should mean a compression of PEs, meaning falling stock prices. Investors pay a premium for expected GROWTH, not for generating the exact same amount of earnings and revenues for the coming year. This means that when E growth slows, P (prices) must decline.
The next level up of difficulty for the stock market would be an actual decline in earnings, or in other words, a negative earnings growth rate vs. the “less positive earnings growth rate” expected at the moment for Q1 and Q2 of 2019. The problem is, no one has any clear idea of how well the economy will be performing beyond Q2 of 2019. The common guesses go out for about a year ahead. Some have nearly meaningless guesses for time periods beyond a year from now. Much can change in a year!
This market drop could end up looking like the 2015 and 2016 declines of about 12-15%. Or if there is more panic involving the currency and debt markets, we could see what I call a “Mini Bear Market” of up to a 25% decline as in 2011 (> 20% drop). It could be the market will consolidate for a while (e.g., up to 6 months as it did in H1 2015) without making new highs before entering a decline. Corporate buybacks could reduce the drawdown from what it might otherwise be.
The main additional positive that could kick in would be resolution of the Trump TradeWar with Europe, Canada, China, and Japan. Trump seems to be making progress with Mexico (presumably with the “nice people” as he calls them). This could temporarily push the markets to new all time highs, before the reality of slowing earnings and revenue growth sets in. (The E and Rev data are at the PDF noted above and are similar to what I showed you last week HERE).
Keep up-to-date during the week at Twitter and StockTwits (links below)…
Follow Me on Twitter® Follow Me on StockTwits®.
SP500 Large Cap Index (click chart to enlarge; SPX, SPY):

SP500 Index falls short. New high delayed.
Survey Says! Sentiment of individual investors (AAII.com) showed a Bull minus Bear percentage spread of +5.33% vs. -2.97% last week. Nothing to comment on here. Not at an extreme and neutrals are not high.
| AAII.Com Individual Investor Sentiment Poll | ||
| Bulls | Neutrals | Bears |
| 36.36% | 32.60% | 31.03% |
| Thurs. 12 am CT close to poll | ||
2. U.S. Small Caps Market Timing (IWM): Small caps are in the middle of a triangle. Last week I said, “Follow the bouncing ball either way out of the triangle.”
Russell 2000 U.S. Small Cap Index (click chart to enlarge; IWM, RUT):

Triangle not resolved.
3. Gold Market Timing (GLD): The problem for gold is that it is hurt by the strong dollar and higher interest rates in the absence of “excess” inflation, which is in fact lacking. The “good news” is that interest rates will decline. The bad news is when other economies are collapsing, money flows into the U.S and into U.S. dollars. Gold is going to be a crap shoot with a downside bias. But follow the chart rather than going into your head. Odds are you won’t figure it out there. By the way, reaching a support level never assures it will hold!
The Gold ETF (click chart to enlarge the chart; GLD):

Gold still near 2017 lows.
4. Interest Rate Market Timing – U.S. 10 Year Treasury Note Yield (TNX): Rates were breaking lower after the CPI report Friday. XLF went down. Meaning? Market expects lower, not higher rates. Surprise, surprise, surprise. Not good for the “continuing U.S. recovery concept.” At least “not without a pause” is my working assumption.
U.S. 10 Year Treasury Note Yield (click chart to enlarge; TNX, IEF, TYX,TLT,TBF):
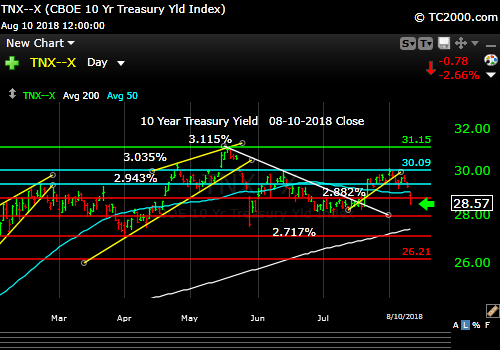
Rates falling – more.
Now let’s review three key market timing signals together….
Do not use these signals as a trading plan. They are rough guidelines. I currently share my own moves on social media (links above).
MY SIGNAL AND TREND SUMMARY for a Further U.S. Stock Market Rally with Real GDP Growth (“real” means above inflation):
Stock Signal NEUTRAL for a further U.S. stock market rally with a Bullish SP500 Index trend. The small caps are a better indicator of the health of the economy, as they are most vulnerable to economic changes. The VIX close on Friday at 13.16 is Neutral. There is room for the VIX to fall to the sub-10 level. Any move back above 13.31 may indicate a developing Bearish trend. A “test” doesn’t count. Friday was a “test” to 13.82.
Gold Signal GREEN for a further U.S. stock market rally with a BEARISH Gold Trend.
Remember GLD is being used as an indicator for the ECONOMY here.
Rate Signal RED for a further stock market rally with a BEARISH 10 Year Yield Trend. Close Friday was 2.857% below last Fri.’s close of 2.953%. On a Fibonacci basis, this could be wave 3 down now, the biggest wave. Alternatively, we could stay range bound above 2.717%.
This Bearish signal will be voided on a close of TNX above 3.035%. As said before: “A more definitive rise above 3.035% would turn the rate trend back to Bullish for rates (bearish for bonds). This level of the 10 Year Treasury Yield, which is too high for current conditions as explained HERE, could eventually slow the economy. The market seems to have adjusted to rates of up to 3% or so as said in the signal summary HERE.”
Note: I’ve updated my criteria for the equity signal for a further U.S. stock market rally to the following: GREEN = Bullish, YELLOW = Neutral, RED = Bearish. In other words, the colors tell you whether the signal supports the stock rally or not, while the Bullish, Neutral, and Bearish designations are about the trend.
NOTE: A BEARISH trend signal does not mean we should not buy. A BULLISH trend signal does not mean you cannot sell some exposure. It depends on what is going on in the economy and how oversold/overbought the market is at a given point whether the Bearish signal is to be sold, sold on the next bounce, etc. and whether a Bullish signal is to be bought or if profits should be taken. A NEUTRAL trend signal does not mean the end of the Bull or Bear. It means to wait and look for possible subsequent entry points within the existing trend, Bull or Bear, but preserve capital if the entry fails. Our strong intention is to buy low and sell high. By the way, I will keep showing the prior orange “Trigger lines” in the charts for now as reference points only; they have historical value for us from the post-2016 election period.
Thank you for reading. Would you please leave your comments below where it says “Leave a Reply”… or ask a question… Pay it forward too by sending the link to MarketTiming.Blog (that link will immediately connect them to this webpage) to a relative or friend. Thanks for doing that.
Be sure to visit the website for more general investing knowledge at:
Standard Disclaimer: It’s your money and your decision as to how to invest it.
I thank Worden Brothers for the charting system I use to post these charts. If you want to know more about the charting system I use every day, go to my “Other Resources” page here: Other Resources It makes it much easier to follow along with me if you can see the charts and manipulate them on your own computer. It’s a great investment to have an excellent charting system. Check it out with a free trial at the link above.
Finally: Excuse and report all typos if you are so moved. I do my best to pick up most of them, but have not always found them all. Shoot me a comment (I don’t have to post your typo report as I filter them before publication, but I’ll be grateful to you!)
Copyright © 2018 By Wall Street Sun and Storm Report, LLC All rights reserved.
