A Market Timing Report based on the 08-17-2018 Close, published Saturday, August 18th, 2018…
I deliver focused comments on market timing once or twice a week. These are supplemented with daily “Tweets/StockTwits” (see links below).
1. SP500 Index Market Timing (S&P 500 Index®; SPY, SPX):
No need to rehash the current set-up as it’s the same as last week as explained HERE. The SP500 Index must reach a new all time high at this point. This could happen based on continued enthusiasm for Q3 earnings and revenues. Q4 2018 and Q1 2019 are another story, as I’ve already shown you (see link just ABOVE labeled “HERE”).
Let’s check in on two signals we’ve been following:
“Intel-igent Market Timing Signal”: Strongly Negative. And even worse this week as the stock was down 6 straight days in a row. (Reminder: INTC is our “tell” on 2nd half earnings in tech as noted HERE. The semiconductor index (SMH) has broken below the 200 day moving average despite the bounce from the June low on Friday as I showed earlier on Friday HERE. Chips are the life blood of economic growth around the world. The weakness in SMH is a bad prognostic sign.
Bank of America (BAC) Market Timing Signal: Negative as it’s off a lower double high and a failed breakout. There is a chance inflation could accelerate a bit longer, which could hold US rates up and hence hold the banks up, but it won’t last long, as global growth decelerates.
I warned last week that any “China hope” could cause the market to rally, and it did. How long that will last is unclear. Talks are supposed to resume by the end of August. There could be new all time highs based on resolution of the trade disputes, but there is a bit of a cloud now too from the 2018 elections where the GOP seems to be in danger, particularly in the House. Regardless of the color of the “Wave” (Blue or Red) about to occur in the elections, the market will be nervous about the uncertainty. Trump could be effectively neutered by the Democrats as Obama was by the Tea Party.
Keep up-to-date during the week at Twitter and StockTwits (links below)…
Follow Me on Twitter® Follow Me on StockTwits®.
SP500 Large Cap Index (click chart to enlarge; SPX, SPY):
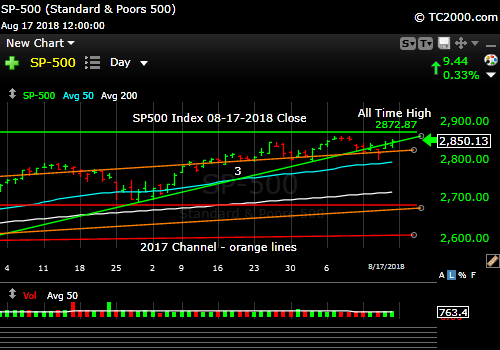
Still an up trend, and we’re staying with it for now.
Survey Says! Sentiment of individual investors (AAII.com) showed a Bull minus Bear percentage spread of +7.09% vs. +5.33% last week. Not at an extreme and neutrals are not high. In the context of being close to all time highs, it’s a bit Bullish actually. They should be elated near all time highs.
| AAII.Com Individual Investor Sentiment Poll | ||
| Bulls | Neutrals | Bears |
| 36.17% | 34.75% | 29.08% |
| Thurs. 12 am CT close to poll | ||
2. U.S. Small Caps Market Timing (IWM): Small caps are now at the top of the triangle. Last week I said, “Follow the bouncing ball either way out of the triangle.” Same idea this week…. If you want to be very conservative, buy the breakout to a new all time high. In any market pullback the beta of small caps can create greater losses. If you believe the market is continuing to new highs and more, then by all means load up on small caps.
Russell 2000 U.S. Small Cap Index (click chart to enlarge; IWM, RUT):

Not out of the triangle.
3. Gold Market Timing (GLD): Same explanation as last week covered in Section #3 HERE. There is room for more losses all the way back to the post-election lows or worse.
The Gold ETF (click chart to enlarge the chart; GLD):

Gold still in down trend.
4. Interest Rate Market Timing – U.S. 10 Year Treasury Note Yield (TNX): I’ve been beating this drum for weeks. The “dumb speculators” are on the wrong side of the trade expecting HIGHER rates, when we will be seeing lower rates in the US and elsewhere as global growth decelerates. The delay is due to the fiscal stimulus in the U.S, which was inappropriate for this point in the economic cycle. But they don’t teach Presidents economics, just nice tinkle down economic theories that have never worked, never without creating massive deficits as happened under both Reagan and G.W. Bush who were both big spenders. Ronald Reagan created the first multi-TRILLION dollar deficits, as I wrote about HERE. They are ALL guilty of spending money they did not have. Congress is filled with fiscally irresponsible people with rare exceptions.
U.S. 10 Year Treasury Note Yield (click chart to enlarge; TNX, IEF, TYX,TLT,TBF):
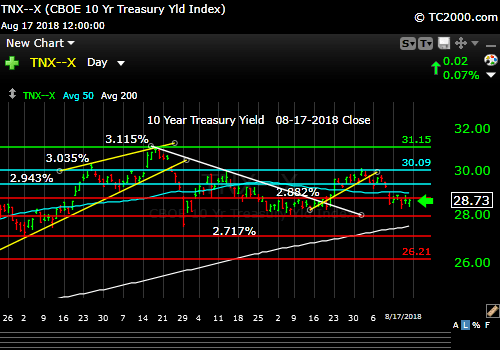
Where are those high interest rates?
Now let’s review three key market timing signals together….
Do not use these signals as a trading plan. They are rough guidelines. I currently share my own moves on social media (links above).
MY SIGNAL AND TREND SUMMARY for a Further U.S. Stock Market Rally with Real GDP Growth (“real” means above inflation):
Stock Signal NEUTRAL for a further U.S. stock market rally with a Bullish SP500 Index trend. The small caps are a better indicator of the health of the economy, as they are most vulnerable to economic changes. They need to signal their direction out of the current triangle shown above. The VIX close on Friday at 12.64 is Bullish. There is room for the VIX to fall to the sub-10 level. Any move back above 13.31 again as happened this past week may indicate a developing Bearish trend. A “test” doesn’t count. This last spike was to 16.86, below the two previous spikes in volatility.
Gold Signal GREEN for a further U.S. stock market rally with a BEARISH Gold Trend.
Remember GLD is being used as an indicator for the ECONOMY here.
Rate Signal RED for a further stock market rally with a BEARISH 10 Year Yield Trend. Rates could remain range bound for a while depending on inflation numbers coming in the next few months. Then they should head lower.
This Bearish signal will be voided on a close of TNX above 3.035%. As said before: “A more definitive rise above 3.035% would turn the rate trend back to Bullish for rates (bearish for bonds). This level of the 10 Year Treasury Yield, which is too high for current conditions as explained HERE, could eventually slow the economy. The market seems to have adjusted to rates of up to 3% or so as said in the signal summary HERE.”
Note: I’ve updated my criteria for the equity signal for a further U.S. stock market rally to the following: GREEN = Bullish, YELLOW = Neutral, RED = Bearish. In other words, the colors tell you whether the signal supports the stock rally or not, while the Bullish, Neutral, and Bearish designations are about the trend.
NOTE: A BEARISH trend signal does not mean we should not buy. A BULLISH trend signal does not mean you cannot sell some exposure. It depends on what is going on in the economy and how oversold/overbought the market is at a given point whether the Bearish signal is to be sold, sold on the next bounce, etc. and whether a Bullish signal is to be bought or if profits should be taken. A NEUTRAL trend signal does not mean the end of the Bull or Bear. It means to wait and look for possible subsequent entry points within the existing trend, Bull or Bear, but preserve capital if the entry fails. Our strong intention is to buy low and sell high. By the way, I will keep showing the prior orange “Trigger lines” in the charts for now as reference points only; they have historical value for us from the post-2016 election period.
Thank you for reading. Would you please leave your comments below where it says “Leave a Reply”… or ask a question… Pay it forward too by sending the link to MarketTiming.Blog (that link will immediately connect them to this webpage) to a relative or friend. Thanks for doing that.
Be sure to visit the website for more general investing knowledge at:
Standard Disclaimer: It’s your money and your decision as to how to invest it.
I thank Worden Brothers for the charting system I use to post these charts. If you want to know more about the charting system I use every day, go to my “Other Resources” page here: Other Resources It makes it much easier to follow along with me if you can see the charts and manipulate them on your own computer. It’s a great investment to have an excellent charting system. Check it out with a free trial at the link above.
Finally: Excuse and report all typos if you are so moved. I do my best to pick up most of them, but have not always found them all. Shoot me a comment (I don’t have to post your typo report as I filter them before publication, but I’ll be grateful to you!)
Copyright © 2018 By Wall Street Sun and Storm Report, LLC All rights reserved.
