A Market Timing Report based on the 08-24-2018 Close, published Saturday, August 25th, 2018…
I deliver focused comments on market timing once or twice a week. These are supplemented with daily “Tweets/StockTwits” (see links below).
1. SP500 Index Market Timing (S&P 500 Index®; SPY, SPX):
I said last week: “The SP500 Index must reach a new all time high at this point. This could happen based on continued enthusiasm for Q3 earnings and revenues.” The market for now is content with the recent strong earnings and revenues and does not see the slowing coming or assumes it will be overcome by Trump tax plan induced growth that is acting on a delay.
Even non-voting member of the Fed, Bullard said U.S. economic growth would slow in 2019, so this is not exactly a secret. Are market participants sitting quietly, fully loaded with stocks just waiting for the prices of their stocks to drop as U.S. GDP growth drops into Q4 2018 and more dramatically in Q1 and Q2 of 2019 as I’ve laid out from published data HERE? You’ll have to decide why the market is moving up rather than down in response to the known slowing of growth coming.
Let’s check in on two signals we’ve been following:
“Intel-igent Market Timing Signal”: Strongly Negative. The stock looks like it is forming a temporary base. 48.50 is a reversal point to watch. (Reminder: INTC is our “tell” on 2nd half earnings in tech as noted HERE. The Semiconductor Index (SMH) is back on track as far as the trend line is concerned. It is rising up off the prior up trend line, which is positive. A turn here? We’ll see.
Bank of America (BAC) Market Timing Signal: Negative as it’s off a lower double high and a failed breakout. The stock is still lingering around that lower high level. As said last week: “There is a chance inflation could accelerate a bit longer, which could hold US rates up and hence hold the banks up, but it won’t last long, as global growth decelerates.” As rates are at the bottom of the recent range, they could rally a bit if inflation data stays warm or goes a bit higher, before falling again.
The China trade war peace treaty remains a hope for the market. It is an excuse for a further rally if anything, as the key is the growth rate of both earnings and revenues for U.S. companies, which are projected to slow, as said. The other fuel for the Bulls is the relatively low level of Bullishness still as I’ll show you after you review the chart just below…
You can see the SP500 Index made a marginal new high (less than 2 points), so it must continue up and not reverse course. Sometimes markets will make a slightly higher high for a couple of days and then sell off. If the rally steps up another notch, it’s likely for real. Many have referred to this process as the “Melt-up.” Markets can go crazy to the upside during melt-ups, but it makes them more vulnerable to disappointment. That does not mean I’m “selling everything.” Not at all. My exposure levels are shared at the social media levels below. I’ve raised some cash, but still have a high level of exposure to the U.S. market (and substantial overexposure vs. foreign markets).
Keep up-to-date during the week at Twitter and StockTwits (links below)…
Follow Me on Twitter® Follow Me on StockTwits®.
SP500 Large Cap Index (click chart to enlarge; SPX, SPY):

SPX hits a new all time high.
Survey Says! Sentiment of individual investors (AAII.com) showed a Bull minus Bear percentage spread of +11.39% vs. +7.09% last week. Bulls are still not at an extreme. In the context of being at all time highs, it’s still Bullish. Investors should be elated at all time highs.
| AAII.Com Individual Investor Sentiment Poll | ||
| Bulls | Neutrals | Bears |
| 38.46% | 34.47% | 27.07% |
| Thurs. 12 am CT close to poll | ||
2. U.S. Small Caps Market Timing (IWM): Last week I said: “Small caps are now at the top of the triangle….“Follow the bouncing ball either way out of the triangle.” If you followed that advice, you may have added to IWM on that breakout above the top of the triangle. I did not, as I feel I have enough exposure to higher beta stocks via IJH (mid caps), which are also at new highs. The small caps are only about mid-channel now, despite being at an all time high, so there is plenty of room for them to rally higher.
Russell 2000 U.S. Small Cap Index (click chart to enlarge; IWM, RUT):

Another breakout above that triangle and in mid channel so has room to rally even more.
3. Gold Market Timing (GLD): Same explanation as two weeks ago covered in Section #3 HERE. Gold is still an iffy bet to make considering the prospects for the U.S. dollar outperforming.
The Gold ETF (click chart to enlarge the chart; GLD):
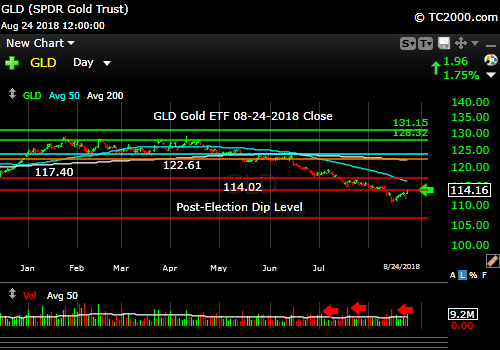
The dollar is beating gold as are U.S. stocks!
4. Interest Rate Market Timing – U.S. 10 Year Treasury Note Yield (TNX): The dumb speculators are going to pay for the error of their thinking, but perhaps not next week. The 10 Year Yield reached the bottom of the recent trading range, so the possibility for a bounce must be considered. If they break even lower, that will be a negative sign for the U.S. economy.
U.S. 10 Year Treasury Note Yield (click chart to enlarge; TNX, IEF, TYX,TLT,TBF):
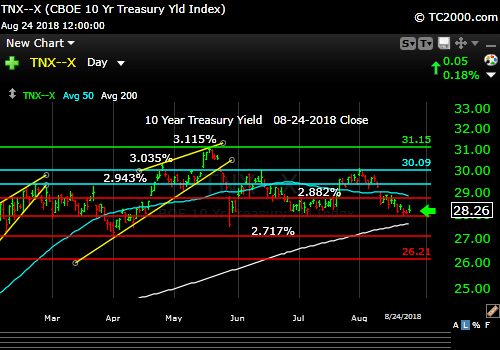
Rates reach the bottom of the range.
Now let’s review three key market timing signals together….
Do not use these signals as a trading plan. They are rough guidelines. I currently share my own moves on social media (links above).
MY SIGNAL AND TREND SUMMARY for a Further U.S. Stock Market Rally with Real GDP Growth (“real” means above inflation):
Stock Signal GREEN for a further U.S. stock market rally with a Bullish SP500 Index trend. The small caps are a better indicator of the health of the economy, as they are most vulnerable to economic changes, and they just hit an ALL TIME HIGH. The VIX (which relates to SPX volatility) closed at 11.99 on Friday vs. 12.64 the previous week and is Bullish. There is room for the VIX to fall to the sub-10 level. Consult my social media posts at the links above for more on VIX targets for the Bulls.
Any move back above VIX 13.31 again may indicate a developing Bearish trend. A “test” doesn’t count. The last spike was to 16.86, below the two previous spikes in volatility.
Gold Signal GREEN for a further U.S. stock market rally with a BEARISH Gold Trend.
Remember GLD is being used as an indicator for the ECONOMY here.
Rate Signal RED for a further stock market rally with a BEARISH 10 Year Yield Trend. Hit the bottom of the range this week. Rates could remain range-bound for a while depending on inflation numbers coming in the next few months. Then they should head lower.
This Bearish signal will be voided on a close of TNX above 3.035%. As said before: “A more definitive rise above 3.035% would turn the rate trend back to Bullish for rates (bearish for bonds). This level of the 10 Year Treasury Yield, which is too high for current conditions as explained HERE, could eventually slow the economy. The market seems to have adjusted to rates of up to 3% or so as said in the signal summary HERE.”
Note: I’ve updated my criteria for the equity signal for a further U.S. stock market rally to the following: GREEN = Bullish, YELLOW = Neutral, RED = Bearish. In other words, the colors tell you whether the signal supports the stock rally or not, while the Bullish, Neutral, and Bearish designations are about the trend.
NOTE: A BEARISH trend signal does not mean we should not buy. A BULLISH trend signal does not mean you cannot sell some exposure. It depends on what is going on in the economy and how oversold/overbought the market is at a given point whether the Bearish signal is to be sold, sold on the next bounce, etc. and whether a Bullish signal is to be bought or if profits should be taken. A NEUTRAL trend signal does not mean the end of the Bull or Bear. It means to wait and look for possible subsequent entry points within the existing trend, Bull or Bear, but preserve capital if the entry fails. Our strong intention is to buy low and sell high. By the way, I will keep showing the prior orange “Trigger lines” in the charts for now as reference points only; they have historical value for us from the post-2016 election period.
Thank you for reading. Would you please leave your comments below where it says “Leave a Reply”… or ask a question… Pay it forward too by sending the link to MarketTiming.Blog (that link will immediately connect them to this webpage) to a relative or friend. Thanks for doing that.
Be sure to visit the website for more general investing knowledge at:
Standard Disclaimer: It’s your money and your decision as to how to invest it.
I thank Worden Brothers for the charting system I use to post these charts. If you want to know more about the charting system I use every day, go to my “Other Resources” page here: Other Resources It makes it much easier to follow along with me if you can see the charts and manipulate them on your own computer. It’s a great investment to have an excellent charting system. Check it out with a free trial at the link above.
Finally: Please excuse and report all typos if you are so moved. I do my best to pick up most of them, but have not always found them all. Shoot me a comment (I don’t have to post your typo report as I filter them before publication, but I’ll be grateful to you!)
Copyright © 2018 By Wall Street Sun and Storm Report, LLC All rights reserved.

A lot of great info Dave, thanks again. Would you know where the oscillator is right now? – Bob.
Thanks Bob. There are many oscillators people follow, but one of them, the McClellan Indicator I have not found that useful except at extremes as we saw in Feb. of this year. You can follow that one on the Worden Brother’s software, for which I have an affiliate link on my website (Top of “Other Resources” at SunAndStormInvesting.com) if you are interested (they’ve never paid me a cent, so most people must make due with the inferior charts on Yahoo etc. ;)).