A Market Timing Report based on the 08-31-2018 Close, published Saturday, September 2nd, 2018…
I deliver focused comments on market timing once or twice a week. These are supplemented with daily “Tweets/StockTwits” (see links below).
1. SP500 Index Market Timing (S&P 500 Index®; SPY, SPX):
We got the new high we were looking for. The trend is still UP.
Let’s check in on two signals we’ve been following:
“Intel-igent Market Timing Signal”: Strongly Negative. Last weeks I said: The stock looks like it is forming a temporary base. 48.50 is a reversal point to watch.” (Reminder: INTC is our “tell” on 2nd half earnings in tech as noted HERE. INTC rose toward, but did not rise above the 50 day moving average. It rose to 48.86 and closed Friday 8-31 at 48.43, barely below the above Bull target. We don’t trade off moving averages, because they don’t reflect accurately when a stock or a market is stretched one way or another, but they are guides. The trend is still DOWN for INTC despite the blip up.
Bank of America (BAC) Market Timing Signal: Last week I said: “Negative as it’s off a lower double high and a failed breakout. The stock is still lingering around that lower high level.” This week, BAC made an even lower high, which is even more negative. The stock must rise above 31.36 to change the trend, and it must not fail another breakout as it has done TWICE now since the May high.
Still true: “The China trade war peace treaty remains a hope for the market. It is an excuse for a further rally if anything, as the key is the growth rate of both earnings and revenues for U.S. companies, which are projected to slow, as said.” (If you are not aware by now that U.S. growth may begin slowing in the to-be-reported quarter (Q3) and that it will start to get far worse by Q1 and Q2 of 2019, you should click the links to the upper right and read the past 4 issues or so!
Sentiment is the one new thing worth looking at this week. First review the chart below and then we’ll discuss sentiment.
Keep up-to-date during the week at Twitter and StockTwits (links below)…
Follow Me on Twitter® Follow Me on StockTwits®.
SP500 Large Cap Index (click chart to enlarge; SPX, SPY):
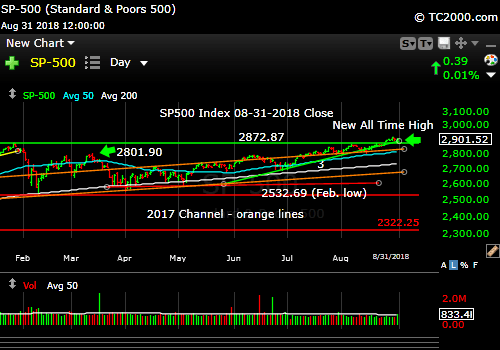
Trend is up until it isn’t.
Survey Says! Sentiment of individual investors (AAII.com) showed a Bull minus Bear percentage spread of +19.11 vs. +11.39% last week. The Bulls did increase this week substantially to nearly 20% through conversion of Bears and some Neutrals.
There are two 2018 data points following the 1-26-18 high with this level of Bullishness and one is irrelevant as it was just after the 2-9-18 low. The current context is very different in volatility terms to that time, so the most recent data points that matters are the spreads of 16.9% to 24.9% achieved on 12-13-17 and 12-20-17, respectively. Let’s back up 3 trading days from 12-20 back to 12-15-17 (between the reporting dates of sentiment for those two weeks) and look at how much the market rallied from there to the 1-26-18 top: 7.36%.
At the January high on 1-26-18, the sentiment spread had already dropped in a down, up, down fashion over a 3 week period to just 21.4% from 44.2% back on 1-03-18 (the peak).
The other data point that is similar is the sentiment spread of 23.1% reached on 6-13-18. The SP500 Index dropped 3.57% from the 6-13 intraday high to the 6-28-18 intraday low.
CONCLUSION: Sentiment is mid-range in Bullishness. Sentiment could fizzle at any point from here, particularly if the election polls turn sour against Trump and his chances of holding both houses of Congress, and if it does decline, we could see a dip of 3 to 4% as we did in the second half of June when sentiment fell from a 23.1% peak on June 13th.
However, there is room to rise to the level of 1-03-18 sentiment of 44.2% or even higher as happened way back in 2000, when investors were even more “Crazy Rich” over-exuberant. If the market return merely matches the return we saw from the last melt-up run into the end of January, we could see a return of +7.36% or more. Then we could see another quick drop down.
Then again, you may want to click on my social media posts and review what I reported for the Sept. dip events over the past 5 years (posted 8-29-17). Not a great pattern for the Bulls except for 2017, when the early Sept. dip was very minimal and was preceded by a another small dip of only about 2% (eyeballing it).
| AAII.Com Individual Investor Sentiment Poll | ||
| Bulls | Neutrals | Bears |
| 43.50% | 32.11% | 24.39% |
| Thurs. 12 am CT close to poll | ||
2. U.S. Small Caps Market Timing (IWM): Still in up trend, so the stock signal below is still Bullish. It’s about in the middle of the up trend (purple lines).
Russell 2000 U.S. Small Cap Index (click chart to enlarge; IWM, RUT):

Small cap up trend continues as well.
3. Gold Market Timing (GLD): Review prior weeks for explanation for the abysmal performance of gold. See those volume spikes on pullbacks?
The Gold ETF (click chart to enlarge the chart; GLD):
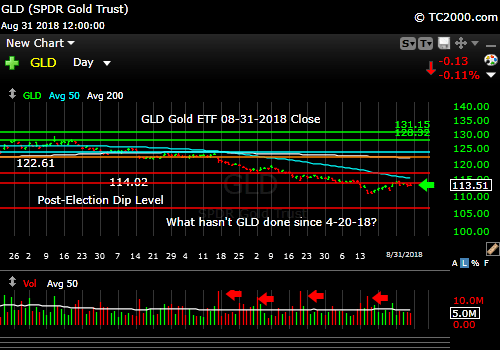
Gold still not showing signs of life.
4. Interest Rate Market Timing – U.S. 10 Year Treasury Note Yield (TNX): Yields did tick up and fell back right at the 50 day moving average (aqua line). Still in down trend. 2.795% yield is the next check point for the Bond Bulls.
U.S. 10 Year Treasury Note Yield (click chart to enlarge; TNX, IEF, TYX,TLT,TBF):

Rates falling…
Now let’s review three key market timing signals together….
Do not use these signals as a trading plan. They are rough guidelines. I currently share my own moves on social media (links above).
MY SIGNAL AND TREND SUMMARY for a Further U.S. Stock Market Rally with Real GDP Growth (“real” means above inflation):
Stock Signal GREEN for a further U.S. stock market rally with a Bullish SP500 Index trend. The small caps are a better indicator of the health of the economy, as they are most vulnerable to economic changes, and hence, are the basis for this signal. The VIX (which relates to SPX volatility) closed at 12.86 on Friday vs. 11.99 the previous week and is Bullish. The VIX spiked to 14.03 on Friday. I would not be shocked to see some early Sept. upside action in the VIX. That said, there is room for the VIX to fall to the sub-10 level should another melt-up pile on occur. Consult my social media posts at the links above for more on VIX targets for the Bulls.
Any move back above VIX 13.31 again may indicate a developing Bearish trend. A “test” doesn’t count. The last bigger spike was to 16.86, below the two previous spikes in volatility.
Gold Signal GREEN for a further U.S. stock market rally with a BEARISH Gold Trend.
Remember GLD is being used as an indicator for the ECONOMY here.
Rate Signal RED for a further stock market rally with a BEARISH 10 Year Yield Trend. It is falling, because the world’s economy is not well. Bond Bears could argue rates could remain range-bound for a while depending on U.S. inflation numbers coming in the next few months. But then yields should head lower despite the Fed’s current hiking bias. In fact, further Fed hikes will pressure the long end of the curve further.
This Bearish signal will be voided on a close of TNX above 3.035%. As said before: “A more definitive rise above 3.035% would turn the rate trend back to Bullish for rates (bearish for bonds). This level of the 10 Year Treasury Yield, which is too high for current conditions as explained HERE, could eventually slow the economy. The market seems to have adjusted to rates of up to 3% or so as said in the signal summary HERE.”
Note: I’ve updated my criteria for the equity signal for a further U.S. stock market rally to the following: GREEN = Bullish, YELLOW = Neutral, RED = Bearish. In other words, the colors tell you whether the signal supports the stock rally or not, while the Bullish, Neutral, and Bearish designations are about the trend.
NOTE: A BEARISH trend signal does not mean we should not buy. A BULLISH trend signal does not mean you cannot sell some exposure. It depends on what is going on in the economy and how oversold/overbought the market is at a given point whether the Bearish signal is to be sold, sold on the next bounce, etc. and whether a Bullish signal is to be bought or if profits should be taken. A NEUTRAL trend signal does not mean the end of the Bull or Bear. It means to wait and look for possible subsequent entry points within the existing trend, Bull or Bear, but preserve capital if the entry fails. Our strong intention is to buy low and sell high. By the way, I will keep showing the prior orange “Trigger lines” in the charts for now as reference points only; they have historical value for us from the post-2016 election period.
Thank you for reading. Would you please leave your comments below where it says “Leave a Reply”… or ask a question… Pay it forward too by sending the link to MarketTiming.Blog (that link will immediately connect them to this webpage) to a relative or friend. Thanks for doing that.
Be sure to visit the website for more general investing knowledge at:
Standard Disclaimer: It’s your money and your decision as to how to invest it.
I thank Worden Brothers for the charting system I use to post these charts. If you want to know more about the charting system I use every day, go to my “Other Resources” page here: Other Resources It makes it much easier to follow along with me if you can see the charts and manipulate them on your own computer. It’s a great investment to have an excellent charting system. Check it out with a free trial at the link above.
Finally: Please excuse and report all typos if you are so moved. I do my best to pick up most of them, but have not always found them all. Shoot me a comment (I don’t have to post your typo report as I filter them before publication, but I’ll be grateful to you!)
Copyright © 2018 By Wall Street Sun and Storm Report, LLC All rights reserved.
