A Market Timing Report based on the 09-07-2018 Close, published Sunday, September 9th, 2018…
I deliver focused comments on market timing once or twice a week. These are supplemented with daily “Tweets/StockTwits” (see links below).
1. SP500 Index Market Timing (S&P 500 Index®; SPY, SPX):
After reaching a new high, the SP500 Index this past week gave up that high by just a bit despite a strong employment number on Friday. Wages were also up. One can argue that the Fed MUST move rates up steadily now, but this does not account for the slowing of growth I’ve been discussing that is starting in Q4 2018 and in the first half of 2019 according to analysts as a group.
The SPX close was 2871.68 vs. the prior high on 1-26-18 of 2872.87, so this represents a test just below the prior high, which may succeed or fail to lead to yet lower prices. The SP500 index is still stretched above the 2017 up channel (orange lines in the chart below), so it can pull back and still maintain the up trend as long as the dip doesn’t take it too low. The last pullback into the end of June took the SP500 Index just below the 50 day moving average. As many of you know, I don’t use moving averages as trading signals. I observe the market when it reaches a moving average to determine its likely behavior in a pivot off such levels.
Let’s check in on two signals we’ve been following:
“Intel-igent Market Timing Signal”: Strongly Negative. Last weeks I said: The stock looks like it is forming a temporary base. 48.50 is a reversal point to watch.” (Reminder: INTC is our “tell” on 2nd half earnings in tech as noted HERE. The stock closed at 46.45 Friday and is testing barely above the prior low of 46.43. Share buybacks could keep it levitated for a while, but remember that they can let it fall and reclaim shares at better prices. Depending on buybacks at support levels like this is not a reliable strategy.
Bank of America (BAC) Market Timing Signal: Negative. It should have rallied with rates this week, and it did not. A series of lower highs with a failed breakout have been established.
This is from two weeks ago but still in play, so I’ll keep it here: “The China trade war peace treaty remains a hope for the market. It is an excuse for a further rally if anything, as the key is the growth rate of both earnings and revenues for U.S. companies, which are projected to slow, as said.” (If you are not aware by now that U.S. growth may begin slowing in the to-be-reported quarter (Q3) and that it will start to get far worse by Q1 and Q2 of 2019, you should click the links to the upper right and read the past 4 issues or so!
Keep up-to-date during the week at Twitter and StockTwits (links below)…
Follow Me on Twitter® Follow Me on StockTwits®.
SP500 Large Cap Index (click chart to enlarge; SPX, SPY):
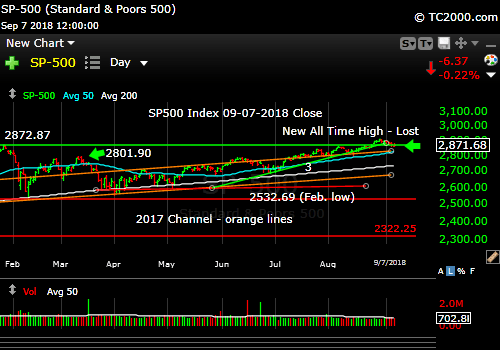
Testing below the Jan. ATH.
Survey Says! Sentiment of individual investors (AAII.com) showed a Bull minus Bear percentage spread of +15.92 vs. +19.11 last week. Sentiment is mildly Bullish at these levels. This week, it is not particularly helpful as a guide. There is room to both fall and rise.
| AAII.Com Individual Investor Sentiment Poll | ||
| Bulls | Neutrals | Bears |
| 42.22% | 31.48% | 26.30% |
| Thurs. 12 am CT close to poll | ||
2. U.S. Small Caps Market Timing (IWM): Still in an up trend, which maintains my stock market signal as Bullish (see at end of report). This week has brought a decline within the Bullish trend channel. The purple line is the base of that channel, and it’s now running along side the 50 day moving average. The line must hold to avoid significantly more damage to the Russell 2000 small caps.
Russell 2000 U.S. Small Cap Index (click chart to enlarge; IWM, RUT):
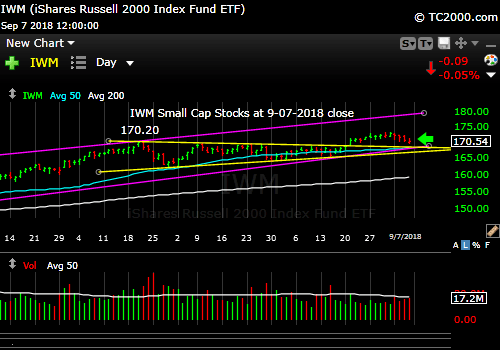
Falling in the channel so far…
3. Gold Market Timing (GLD): Review prior weeks (2 weeks back at least) for explanation for the abysmal performance of gold. With the economy still strong and Fed rates rising ahead of inflation, which may have peaked out at this point, gold has little reason to rally. Further currency crises around the world and U.S. growth slowing could lead to better gold returns at the end of the year and in early 2019.
The Gold ETF (click chart to enlarge the chart; GLD):
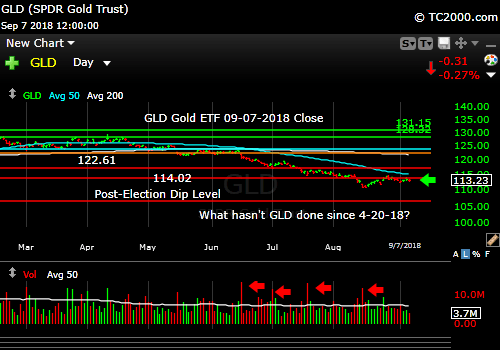
Could get even weaker if economy keeps booming. Only end of 2018 into 2019 slowing or world crisis can lift gold.
4. Interest Rate Market Timing – U.S. 10 Year Treasury Note Yield (TNX): Rates ticked up within the recent range as I warned they could, based on the strong employment report on Friday along with strong wage growth, but this does not mean we’re headed to new inflation highs, unless President Trump drives us into a global trade war. As we know, he negotiates using strong arm tactics, but in the end, he cannot want to seriously hurt consumers who depend on cheap foreign imports. This could lead to a period of stagflation if he does. I doubt he’d be happy with his GDP numbers under those circumstances.
The Supreme Lifetime leader of China, Xi, has much more negotiating room than Trump has! Check below in my signal summary to see the rate level when things begin to look Bullish again for rates rising. When the market changes, we change our minds. Being stubborn is a dumb practice in general, and it costs us big bucks in investing when we don’t adjust to the changes we see.
Pay close attention to the PPI and CPI inflation numbers out this week on Weds. and Thurs., respectively!
Check out the market signal summary below, after you review the chart…
U.S. 10 Year Treasury Note Yield (click chart to enlarge; TNX, IEF, TYX,TLT,TBF):
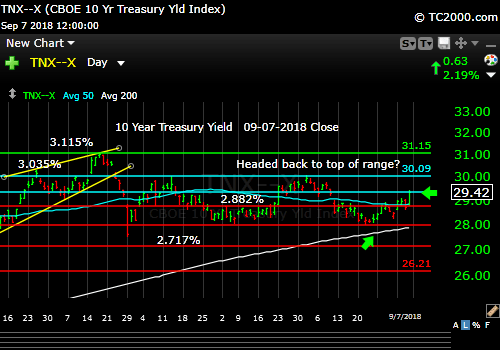
Rates rising in the range on wage inflation.
Now let’s review three key market timing signals together….
Do not use these signals as a trading plan. They are rough guidelines. I currently share my own moves on social media (links above).
MY SIGNAL AND TREND SUMMARY for a Further U.S. Stock Market Rally with Real GDP Growth (“real” means above inflation):
Stock Signal GREEN for a further U.S. stock market rally with a Bullish SP500 Index trend. I won’t relabel the SPX trend based on a micro drop below the Jan. 2018 high.
The small caps are a better indicator of the health of the economy, as they are most vulnerable to economic changes, and hence, are the basis for this signal. The VIX (which relates to SPX volatility) closed at 14.88 on Friday vs. 12.86 the previous week and is Bearish. From past week: “I would not be shocked to see some early Sept. upside action in the VIX.” There you go…
I also said: “Any move back above VIX 13.31 again may indicate a developing Bearish trend. A ‘test’ doesn’t count. The last bigger spike was to 16.86, below the two previous spikes in volatility.” The Bears must get through VIX 16.86 to turn this dip into a correction.
Gold Signal GREEN for a further U.S. stock market rally with a BEARISH Gold Trend.
Remember GLD is being used as an indicator for the ECONOMY here.
Rate Signal RED for a further stock market rally with a BEARISH 10 Year Yield Trend. From last week: “It is falling, because the world’s economy is not well. Bond Bears could argue rates could remain range-bound for a while depending on U.S. inflation numbers coming in the next few months. But then yields should head lower despite the Fed’s current hiking bias. In fact, further Fed hikes will pressure the long end of the curve further.”
This Bearish signal will be voided on a close of TNX above 3.035%. As said before: “A more definitive rise above 3.035% would turn the rate trend back to Bullish for rates (bearish for bonds). This level of the 10 Year Treasury Yield, which is too high for current conditions as explained HERE, could eventually slow the economy. The market seems to have adjusted to rates of up to 3% or so as said in the signal summary HERE.”
Note: I’ve updated my criteria for the equity signal for a further U.S. stock market rally to the following: GREEN = Bullish, YELLOW = Neutral, RED = Bearish. In other words, the colors tell you whether the signal supports the stock rally or not, while the Bullish, Neutral, and Bearish designations are about the trend.
NOTE: A BEARISH trend signal does not mean we should not buy. A BULLISH trend signal does not mean you cannot sell some exposure. It depends on what is going on in the economy and how oversold/overbought the market is at a given point whether the Bearish signal is to be sold, sold on the next bounce, etc. and whether a Bullish signal is to be bought or if profits should be taken. A NEUTRAL trend signal does not mean the end of the Bull or Bear. It means to wait and look for possible subsequent entry points within the existing trend, Bull or Bear, but preserve capital if the entry fails. Our strong intention is to buy low and sell high. By the way, I will keep showing the prior orange “Trigger lines” in the charts for now as reference points only; they have historical value for us from the post-2016 election period.
Thank you for reading. Would you please leave your comments below where it says “Leave a Reply”… or ask a question… Pay it forward too by sending the link to MarketTiming.Blog (that link will immediately connect them to this webpage) to a relative or friend. Thanks for doing that.
Be sure to visit the website for more general investing knowledge at:
Standard Disclaimer: It’s your money and your decision as to how to invest it.
I thank Worden Brothers for the charting system I use to post these charts. If you want to know more about the charting system I use every day, go to my “Other Resources” page here: Other Resources It makes it much easier to follow along with me if you can see the charts and manipulate them on your own computer. It’s a great investment to have an excellent charting system. Check it out with a free trial at the link above.
Finally: Please excuse and report all typos if you are so moved. I do my best to pick up most of them, but have not always found them all. Shoot me a comment (I don’t have to post your typo report as I filter them before publication, but I’ll be grateful to you!)
Copyright © 2018 By Wall Street Sun and Storm Report, LLC All rights reserved.
