A Market Timing Report based on the 09-14-2018 Close, published Saturday, September 15th, 2018…
I deliver focused comments on market timing once or twice a week. These are supplemented with daily “Tweets/StockTwits” (see links below).
1. SP500 Index Market Timing (S&P 500 Index®; SPY, SPX):
Complacency has its rewards. Fewer words… I have telegraphed much of what is expected to go down over the next 3 quarters of earnings reports in the U.S. both in posts on this blog and on social media. I recommend reviewing the posts going back to August, as there is no need to repeat what has been said. This prior report is especially important: HERE. And I assess the probable degree of decline HERE. These briefs are supposed to be about “focused comments.”
Let’s check in on two signals we’ve been following:
“Intel-igent Market Timing Signal”: Strongly Negative. 46.19 is now the reversal point to watch. Previously it was 48.50, so things are getting worse. (Reminder: INTC is our “tell” on 2nd half earnings in tech as noted HERE.) The stock closed at 45.54 Friday below the prior low of 46.19. Intel is in its very own Bear Market, down 20.94% from the all time intraday high, and that’s after a small bounce on Weds. and Thurs.
Bank of America (BAC) Market Timing Signal: Negative. Rates were rising this week but this financial “tell” was not! Something is off here. I’m betting rates will not keep rising, at least not for long. The stock is holding just above the 8-15-2018 low of 30.16, which must hold. A breach of that would mean a revisit of the Feb. low.
This is from THREE weeks ago but is still in play, so I’ll keep it here: “The China trade war peace treaty remains a hope for the market. It is an excuse for a further rally if anything, as the key is the growth rate of both earnings and revenues for U.S. companies, which are projected to slow, as said.” (If you are not aware by now that U.S. growth may begin slowing in the current quarter (Q3) (Pepsi begins with its report on Oct. 2nd, and the big banks report on Oct. 11th) and that it will start to get far worse by Q1 and Q2 of 2019, you should click the links to the upper right and read the pertinent prior issues!
The Bull caveat? Increased capital spending from the Trump/GOP Tax Bill could mitigate some of the shortfall seen by analysts mentioned in my August blog posts. How much of a boost this could provide is unclear, but it will add somewhat to GDP in the 3rd and 4th quarters of 2018 and could carry through into 2019. This could reduce a potential pullback of the market over the next three quarters. The guesswork is good out to about a year, but is less reliable the farther out you go in time.
The Bear caveat? U.S. multinationals depend on foreign sales for about half of their revenue, which means the current global growth slowing will be reading through to U.S. GDP vs. the positive effects of the tax bill.
The US Dollar strength that is the result of Ex-US growth slowing will begin impacting U.S. multinational results in the current quarter as the dollar was HIGHER than the prior year starting in July 2018 and this will continue through the following June if the dollar simply stops at this level. If rates do fall in the U.S. as U.S. growth slows, the dollar will slip and shorten the window of impact.
Keep up-to-date during the week at Twitter and StockTwits (links below)…
Follow Me on Twitter® Follow Me on StockTwits®.
SP500 Large Cap Index (click chart to enlarge; SPX, SPY): Is another all time high coming prior to U.S. GDP slowing particularly in Q4 2018 and Q1 and Q2 2019? The prior SPX dip was to just 1 point below the key breakout above the Jan. high. This by itself is positive and affirms the up trend, but another new high is needed soon to confirm the Bullish stance of the market.

Retest of top or more?
Survey Says! Sentiment of individual investors (AAII.com) showed a Bull minus Bear percentage spread of -0.75% vs. +15.92 last week. Sentiment was flattened out to a flat spread. There is plenty of room to both fall and rise. Since we are approaching the all time high again, this by itself is more Bullish than Bearish. Tops are not generally formed when investors are divided and likely confused! Whether we get to a new high immediately or not, this says the Bull market is likely not yet done. Remember this is just one piece of a much larger picture, and trading on sentiment is iffy, particularly when it is not at extremes.
| AAII.Com Individual Investor Sentiment Poll | ||
| Bulls | Neutrals | Bears |
| 32.09% | 35.07% | 32.84% |
| Thurs. 12 am CT close to poll | ||
2. U.S. Small Caps Market Timing (IWM): Small caps are still in an up trend, which maintains my stock market signal as Bullish (see at end of report). Since the 8-15-18 low, small caps and mid caps have kept up with large caps. Prior to that, off the 6-27-18 low, small and mid caps both trailed the SP500 Index, so the recent behavior of the smaller stocks is an improvement. This is Bullish for the overall market.
Russell 2000 U.S. Small Cap Index (click chart to enlarge; IWM, RUT):
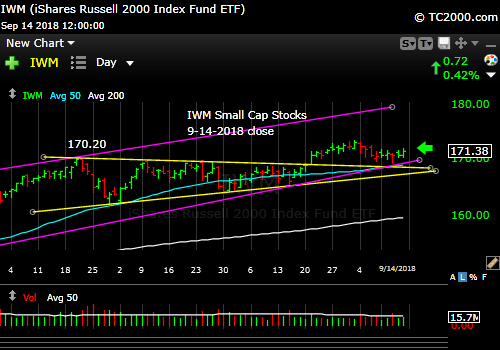
Small caps rising in channel for now.
3. Gold Market Timing (GLD): Review the issues of the prior weeks (2 weeks back at least) for an explanation for the abysmal performance of gold. Zero progress this week.
The Gold ETF (click chart to enlarge the chart; GLD):

Gold has no game.
4. Interest Rate Market Timing – U.S. 10 Year Treasury Note Yield (TNX): Rates ticked up within the recent range as I warned they could. PPI and CPI were both weaker Y/Y, so the rise should be limited. If not, I change my mind. I added to intermediate term Treasuries on Friday. To see what ETF I used, please click the social media links above.
This chart shows how the ANNUAL Rate of Inflation is coming off peak (potentially): HERE
Note the inflation rate (CPI) is 2.7% Y/Y, which means if you made less than that on your cash over the past year, you have lost buying power. Remember CPI is considered to underestimate true inflation, but for now, let’s use it as a guide.
How many years do you have to go out to make 2.7% or more in Yield to Maturity terms? These are real Treasury notes I found in the market:
1. To make the CPI over the past year of 2.7% – you’d need to buy a Treasury Note maturing in 1 year, 5 months, and 14 days dated 2-29-2020 maturity.
2. 2.8%: 2 years and 4 months, 1-15-2021 maturity
3. 2.9%: 4 years, 2 months, 15 days, 11-30-2022 maturity
4. 2.994%: 10 Years. That’s the yield of the 10 Year Treasury Note currently.
Yield Curve: You can see the quotes in round years from the Treasury: HERE
You can see there is not much more you are getting by going out past 1 1/2 years, but if rates fall, the longer term bonds will appreciate in value. You then need to trade out of them after the global economic slowing passes, as rates will then rise again, and bond prices will fall. This is a trade only that could pay off within a few quarters and then end…
Check out the “Market Signal Summary” below – after you review the following chart…
U.S. 10 Year Treasury Note Yield (click chart to enlarge; TNX, IEF, TYX,TLT,TBF):

Rates ticking up. How far? PPI and CPI data are coming in weak Y/Y.
Now let’s review three key market timing signals together….
Do not use these signals as a trading plan. They are rough guidelines. I currently share my own moves on social media (links above).
MY MARKET SIGNAL AND TREND SUMMARY for a Further U.S. Stock Market Rally with Real GDP Growth (“real” means above inflation):
Stock Signal GREEN for a further U.S. stock market rally with a Bullish SP500 Index trend.
The small caps are a better indicator of the health of the economy, as they are most vulnerable to economic changes, and hence, are the basis for this signal. The VIX (which relates to SPX volatility) closed at 12.07 on Friday vs. a Bearish 14.88 the previous week and is now Bullish.
What must the VIX do this week? As I said previously: “Any move back above VIX 13.31 again may indicate a developing Bearish trend. A ‘test’ doesn’t count. The last bigger spike was to 16.86, below the two previous spikes in volatility.” The Bears must get through VIX 16.86 to spark a correction. The last little dip to the Sept. 7th low was only 1.73% which is more of a blip than a dip.
Gold Signal GREEN for a further U.S. stock market rally with a BEARISH Gold Trend.
Remember GLD is being used as an indicator for the ECONOMY here.
Rate Signal NEUTRAL for a further stock market rally with a NEUTRAL 10 Year Yield Trend. The signal goes to neutral this week, as it is challenging the top of an important range. From 3 weeks ago: “It [TNX] is falling, because the world’s economy is not well. Bond Bears could argue rates could remain range-bound for a while depending on U.S. inflation numbers coming in the next few months. But then yields should head lower despite the Fed’s current hiking bias. In fact, further Fed hikes will pressure the long end of the curve further.” My opinion has not changed. I would be surprised to see a new recent TNX high above 3.115%.
This signal will be tentatively Bullish given a new TNX high on a close of TNX above 3.035%. As said before: “A more definitive rise above 3.035% would turn the rate trend back to Bullish for rates (Bearish for bonds). This level of the 10 Year Treasury Yield, which is too high for current conditions as explained HERE, could eventually slow the economy. The market seems to have adjusted to rates of up to 3% or so as said in the signal summary HERE.”
Note: I’ve updated my criteria for the equity signal for a further U.S. stock market rally to the following: GREEN = Bullish, YELLOW = Neutral, RED = Bearish. In other words, the colors tell you whether the signal supports the stock rally or not, while the Bullish, Neutral, and Bearish designations are about the trend.
NOTE: A BEARISH trend signal does not mean we should not buy. A BULLISH trend signal does not mean you cannot sell some exposure. It depends on what is going on in the economy and how oversold/overbought the market is at a given point whether the Bearish signal is to be sold, sold on the next bounce, etc. and whether a Bullish signal is to be bought or if profits should be taken. A NEUTRAL trend signal does not mean the end of the Bull or Bear. It means to wait and look for possible subsequent entry points within the existing trend, Bull or Bear, but preserve capital if the entry fails. Our strong intention is to buy low and sell high. By the way, I will keep showing the prior orange “Trigger lines” in the charts for now as reference points only; they have historical value for us from the post-2016 election period.
Thank you for reading. Would you please leave your comments below where it says “Leave a Reply”… or ask a question… Pay it forward too by sending the link to MarketTiming.Blog (that link will immediately connect them to this webpage) to a relative or friend. Thanks for doing that.
Be sure to visit the website for more general investing knowledge at:
Standard Disclaimer: It’s your money and your decision as to how to invest it.
I thank Worden Brothers for the charting system I use to post these charts. If you want to know more about the charting system I use every day, go to my “Other Resources” page here: Other Resources It makes it much easier to follow along with me if you can see the charts and manipulate them on your own computer. It’s a great investment to have an excellent charting system. Check it out with a free trial at the link above.
Finally: Please excuse and report all typos if you are so moved. I do my best to pick up most of them, but have not always found them all. Shoot me a comment (I don’t have to post your typo report as I filter them before publication, but I’ll be grateful to you!)
Copyright © 2018 By Wall Street Sun and Storm Report, LLC All rights reserved.
