A Market Timing Report based on the 09-21-2018 Close, published Saturday, September 22, 2018…
I deliver focused comments on market timing once or twice a week. These are supplemented with daily “Tweets/StockTwits” (see links below).
1. SP500 Index Market Timing (S&P 500 Index®; SPY, SPX):
The SP500 Index tested below the prior breakout above the 1-26-2018 all time high (marked by the second green line from the top in the chart below) reaching a low of 2864.12 on Sept. 7th, and then resumed its up trend. These retracement tests of breakouts are not uncommon. We are now at a brand new all time high, but it’s been just 2 days. Most traders like to see three days of confirmation of a breakout. We cannot judge the volume due to the fact it was a big options expiration day, when volume always spikes.
You can see on the chart below that the up trend has lost some strength in getting to this all time high. It is BELOW the green upward slanting line, which was the prior up trend. It must rise above there to further prove the strength of this rally. This is all happening at a time when the China tariffs have been set by Pres. Trump at 10% for most products pending a further increase to 25% should China not comply with U.S. demands and reach a trade deal that addresses U.S. grievances.
The market seems to interpret Trump’s strategy net positively for now as it has reached all time highs despite it. There are certain companies/industries that may be disproportionately impacted of course, but overall the market has given a tentative thumbs up to the current strategy. This is likely at least part of what propelled the market to a new all time high this week as I said it would several weeks in a row.
Remember that whatever Trump gets from China, he’ll call a win, although I am impressed by the extent of his brinkmanship on trade so close to the midterm elections that could render him essentially a legislatively powerless President. The Democrats are said to more likely flip the House than the Senate, but if they flip either, Trump will be dead in the water, at least for two years, until he attempts to flip things back in 2020 along with his re-election. Results still pending!
What stands in the way of this market now is NOT Trump or the Trump Trade War, but the relative slowing of growth that is due to occur to a lesser degree in Q4, but to a greater degree in Q1 and Q2 of 2019 as I went over in detail this past August (see Aug. 3 and Aug 10 issues).
FactSet has an updated summary of the approximate HALVING of earnings growth in 2019 vs. 2018 per analysts HERE. To get a taste of what’s brewing they noted “Highest Percentage of Negative EPS Preannouncements for S&P 500 Since Q1 2016.” Of the 98 companies in the SP500 issuing guidance, 74 have guided negatively (74/98 = 75.51%) and 24 positively (24.49%) or roughly a 76%/24% split in favor of negative guidance.
To put it simply, a halving of E growth (earnings) for 2019 vs. 2018 means PEs are suddenly too high, because they are indirectly based on earnings growth rates unless a stock is a “mature company” throwing off lots of earnings at a steady though barely increasing rate. This is why high dividend, low beta stocks tend to do better in periods of slowing growth.
If you believe the Trump tax cuts are going to read through and drive GDP much higher than analysts believe, then keep your current exposure where it is and don’t budge when the market falls. If you don’t, consider cutting some exposure or doing so in steps as the market falls and attempting to capture further gains via “Passive Shorting” a term I coined HERE.
It’s hard to be out early, yes, but it could be hard watching this year’s gains in tech, consumer discretionary, etc. dissolve. There could be a lag in the market response, and maybe the market will move up a few more percent before a correction starts. That is impossible to predict, so I won’t bother trying! It’s a waste of time.
I’ve cut my exposure a bit as shared on social media and have changed sector exposure levels to raise them in REITs and healthcare and lower SP500 Index exposure.
A bit of a warning is in order though: Only a lower exposure level OR being short, which most investors won’t ever do it seems, are ways to avoid an absolute decline in assets unless your stocks are those that can levitate through draw-downs (not many of those)!
The Bull warning is that this is still a Bull market. In fact, all three of my signals for a continuing Bull market are green now (Rate signal is pending verification though as noted below).
The trend in stocks is still up, so I am content with my current positioning, capturing the vast majority of equity gains vs. max exposure, largely avoiding foreign markets, and increasing exposure to SPX sectors that do better in “growth slowing” periods. I will watch for a volatility spike most likely before selling more stock exposure.
Now let’s check in on two “Canary Signals” we’ve been following:
“Intel-igent Market Timing Signal” (Intel; INTC): Negative, but let’s watch for a continued reversal to the upside. I said last week: “46.19 is now the reversal point to watch.” (Reminder: INTC is our “tell” on 2nd half earnings in tech as noted HERE. Micron (MU) is another tech stock to watch as it just gave negative guidance this past week.) INTC closed at 46.66 Friday ABOVE the prior low of 46.19, but if it continues to turn downward on Monday, this reversal will likely be lost and we’ll see another lower low.
Bank of America (BAC) Market Timing Signal: Negative. Friday’s action brought the stock back below 31.36, which was the lower high it was trying to exceed. It got to 31.37 and reversed. No coincidence there. Just as last week: “Rates were rising this week but this financial ‘tell’ could not make it over the lower high just mentioned.”
Keep up-to-date during the week at Twitter and StockTwits (links below)…
Follow Me on Twitter® Follow Me on StockTwits®.
SP500 Large Cap Index (click chart to enlarge; SPX, SPY): We did get the fresh all time high (ATH) this week, so the trend is still up with the caveats noted above!
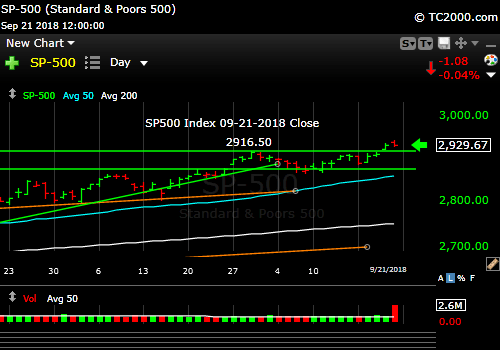
New all time high. Is this just a marginal new high or will the trend continue?
Survey Says! Sentiment of individual investors (AAII.com) showed a Bull minus Bear percentage spread of 0.00% vs. -0.75% last week. The same comment applies this week as last: “Sentiment was flattened out to a flat spread. There is plenty of room to both fall and rise.” Since we are at another all time high for the SP500 Index this week, the sentiment spread by itself is more Bullish than Bearish. Tops are not generally formed when investors are divided and likely confused! Whether we get to a new high immediately or not, this says the Bull market is likely not yet done.
| AAII.Com Individual Investor Sentiment Poll | ||
| Bulls | Neutrals | Bears |
| 32.04% | 35.92% | 32.04% |
| Thurs. 12 am CT close to poll | ||
2. U.S. Small Caps Market Timing (IWM): Small caps are still in an up trend, which maintains my stock market signal as Bullish (see at end of report). IWM closed just barely (0.20 points) above the prior breakout shown on the chart below (to the left in white numbers!). This means a reversal to the downside could still occur. The ETF is trading almost precisely on the lower channel line shown in purple. A strong move up early in the week will reaffirm the up trend. If not, there are plenty of potential downside targets. I evaluate various levels in real time as we arrive at them, so stay tuned on social media via the links above.
Russell 2000 U.S. Small Cap Index (click chart to enlarge; IWM, RUT):

Small caps are holding above our key breakout number still, but barely.
3. Gold Market Timing (GLD): Review the issues of the prior weeks (3 weeks back at least) for an explanation for the abysmal performance of gold. No life being shown. This could change as economic growth slows. Bonds will rally as rates fall. If there is international panic, gold and the dollar can rise together. Google “When does gold shine and when does it decline?” and you’ll find my article.
The Gold ETF (click chart to enlarge the chart; GLD):
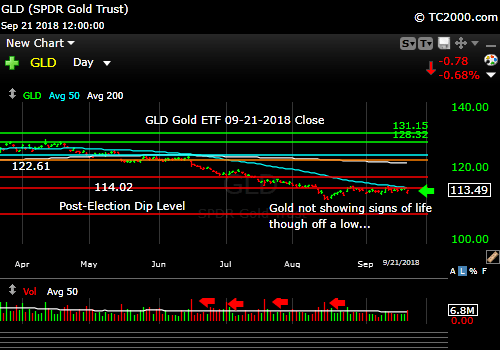
Gold remains in a slump due to the relatively strong dollar and higher rates.
4. Interest Rate Market Timing – U.S. 10 Year Treasury Note Yield (TNX):
If Ex-U.S. global growth has already slowed and is slowing further, and U.S. growth is also slated to slow slightly in Q4 and more dramatically in Q1 and Q2 of 2019, then rates should fall into 2019. It’s not always possible to pick the exact top of a chart of course, and I am a bit early, but my assessment is that rates at this level given the what is happening in the rest of the world in terms of interest rates is unsustainable.
By the way, I picked IEF over TLT, because I thought there was some risk of being a bit early on this one. TLT will provide a bigger bang as rates fall however. This quarter’s SP500 Index earnings will still be strong, so this puts upward pressure on rates. They assume the Fed will just keep raising rates for the next few years. I do not assume that!
This is a trade that could be over within a few quarters...and of course, the thesis could be wrong. My advice is to change your mind when you’re wrong. There will always be another trade, but not for the stubborn. They lose too much capital. Only a new high above the top green line in the chart below would change this rate assessment.
Check out the “Market Signal Summary” below – after you review the following chart…
U.S. 10 Year Treasury Note Yield (click chart to enlarge; TNX, IEF, TYX,TLT,TBF):
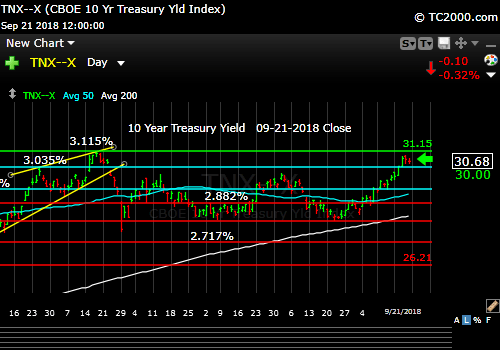
Have rates finally peaked? CPI and PPI may have peaked as mentioned last week.
Now let’s review three key market timing signals together….
Do not use these signals as a trading plan. They are rough guidelines. I currently share my own moves on social media (links above).
MY MARKET SIGNAL AND TREND SUMMARY for a Further U.S. Stock Market Rally with Real GDP Growth (“real” means above inflation):
Stock Signal GREEN for a further U.S. stock market rally with a Bullish SP500 Index trend.
The small caps are a better indicator of the health of the economy, as they are most vulnerable to economic changes, and hence, are the basis for this signal. The VIX (which relates to SPX volatility) closed at 11.68 on Friday vs. 12.07 the previous week. This is Bullish for the SP500 Index.
What must the VIX do this week? As I said previously: “Any move back above VIX 13.31 again may indicate a developing Bearish trend. A ‘test’ doesn’t count. The last bigger spike was to 16.86, below the two previous spikes in volatility.” The Bears must get through VIX 16.86 to spark a bigger correction. The last little dip to the Sept. 7th low was only 1.73% which is more of a blip than a dip. The Bulls need to take out the lowest VIX targets I shared on social media (links above) this week to keep the momentum.
Gold Signal GREEN for a further U.S. stock market rally with a BEARISH Gold Trend.
Remember GLD is being used as an indicator for the ECONOMY here.
Rate Signal GREEN (tentatively pending a new high above that green line in the TNX chart above) for a further stock market rally with a Bullish 10 Year Yield Trend. My opinion has not changed. I would be surprised to see a sustained new recent TNX high above 3.115%.
Why did I change the signal? I said previously “This signal will be tentatively Bullish given a new TNX high on a close of TNX above 3.035%.” This level of the 10 Year Treasury Yield, which is too high for current conditions as explained HERE, could eventually slow the economy. The market seems to have adjusted to rates of up to 3% or so as said in the signal summary HERE.” A rapid push higher in rates would mean trouble for stocks, as occurred in early 2018.
Note: I’ve updated my criteria for the equity signal for a further U.S. stock market rally to the following: GREEN = Bullish, YELLOW = Neutral, RED = Bearish. In other words, the colors tell you whether the signal supports the stock rally or not, while the Bullish, Neutral, and Bearish designations are about the trend.
NOTE: A BEARISH trend signal does not mean we should not buy. A BULLISH trend signal does not mean you cannot sell some exposure. It depends on what is going on in the economy and how oversold/overbought the market is at a given point whether the Bearish signal is to be sold, sold on the next bounce, etc. and whether a Bullish signal is to be bought or if profits should be taken. A NEUTRAL trend signal does not mean the end of the Bull or Bear. It means to wait and look for possible subsequent entry points within the existing trend, Bull or Bear, but preserve capital if the entry fails. Our strong intention is to buy low and sell high. By the way, I will keep showing the prior orange “Trigger lines” in the charts for now as reference points only; they have historical value for us from the post-2016 election period.
Thank you for reading. Would you please leave your comments below where it says “Leave a Reply”… or ask a question… Pay it forward too by sending the link to MarketTiming.Blog (that link will immediately connect them to this webpage) to a relative or friend. Thanks for doing that.
Be sure to visit the website for more general investing knowledge at:
Standard Disclaimer: It’s your money and your decision as to how to invest it.
I thank Worden Brothers for the charting system I use to post these charts. If you want to know more about the charting system I use every day, go to my “Other Resources” page here: Other Resources It makes it much easier to follow along with me if you can see the charts and manipulate them on your own computer. It’s a great investment to have an excellent charting system. Check it out with a free trial at the link above.
Finally: Please excuse and report all typos if you are so moved. I do my best to pick up most of them, but have not always found them all. Shoot me a comment (I don’t have to post your typo report as I filter them before publication, but I’ll be grateful to you!)
Copyright © 2018 By Wall Street Sun and Storm Report, LLC All rights reserved.
