A Market Timing Report based on the 09-28-2018 Close, published Saturday, September 29th, 2018…
I deliver focused comments on market timing once or twice a week. These are supplemented with daily “Tweets/StockTwits” (see links below).
1. SP500 Index Market Timing (S&P 500 Index®; SPY, SPX):
Cracks in the Bull thesis are showing up now. No big trend changes yet, but cracks, which could lead to more. The SP500 Index made a new high and then pulled back below the prior breakout. Since around July 10th, the SP500 has been tracking the upper 2017 channel line noted in orange on the chart below. It is still above that upper channel line, so there is no way I can consider the index to be significantly weak yet.
Still, we are also below the prior green up trend line, so the market has weakened just a bit from the prior rapid incline. My concern is that the small caps are flirting with significantly more danger now, by slicing through their lower channel line noted in purple on the 2nd chart below. Small caps need to confirm the large cap move as the market rises, or the underlying health of the rally is called into question.
This early weakness in small caps, which in terms of capital gains have lost people money since the 6-20-2018 high over 3 months ago, may be an indicator that if growth is in fact going to slow, investors want to lower their exposure to higher beta small cap stocks now vs. later, ahead of the Q4 slowing and even more dramatic Q1 and Q2 2019 U.S. slowing of earnings and revenue growth outlined last week and in early August on this blog.
Pay some attention to the blow ups happening outside the U.S. Italy fell 3.72% on Friday. This is a bad sign about EU growth slowing that has started in advance of U.S. growth slowing. This is a global economy. We don’t grow as fast when growth is slowing in the EU, Japan, and China! Meanwhile the canary is at least warming up its voice in the U.S. as there has been a big increase in negative pre-announcements for Q3, as discussed last week.
Now let’s check in on two “Canary Signals” we’ve been following:
“Intel-igent Market Timing Signal” (Intel; INTC): Negative, but on Friday there was an upside reversal that still kept INTC below its 50 day moving average. I said previously: “46.19 is now the reversal point to watch.” (Reminder: INTC is our “tell” on 2nd half earnings in tech as noted HERE. Micron (MU) is another tech stock to watch as it just gave negative guidance this past week.) INTC closed at 47.29 Friday ABOVE the prior low of 46.19. Moving up further and closing above 47.42 would add a higher high to the picture and strengthen the trading position of INTC.
Bank of America (BAC) Market Timing Signal: Negative. No, actually “miserable.” Friday’s action brought the stock back to 29.46 in a big sell off on Friday that was the 6th down day of 6. Rates were falling again after the Fed FOMC statement that they would raise rates, and so were financials (XLF and BAC). We’d expect the opposite in an economy the market expected to remain strong. Rates above the prior high shown on the TNX chart below would be required to spark a strong financial sector rally. That doesn’t look probable right now.
Keep up-to-date during the week at Twitter and StockTwits (links below)…
Follow Me on Twitter® Follow Me on StockTwits®.
SP500 Large Cap Index (click chart to enlarge; SPX, SPY):
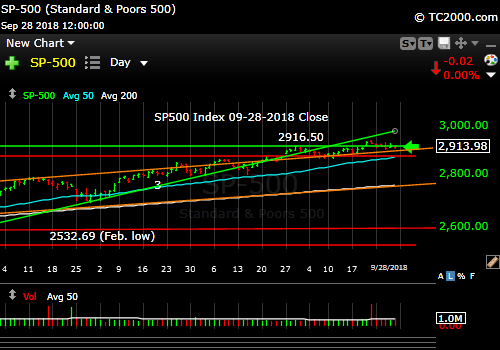
Still making higher highs though below the prior breakout.
Survey Says! Sentiment of individual investors (AAII.com) showed a Bull minus Bear percentage spread of +5.12% vs. 0.00% last week. Sentiment is not very helpful in this range of spreads. It says investors are only mildly Bullish just shy of an all time high. If anything, that is somewhat Bullish for the 6 month outlook, which the survey assesses.
| AAII.Com Individual Investor Sentiment Poll | ||
| Bulls | Neutrals | Bears |
| 36.22% | 32.68% | 31.10% |
| Thurs. 12 am CT close to poll | ||
2. U.S. Small Caps Market Timing (IWM): Small caps are weakening as discussed above. A fall below the two converging yellow lines would not work out well. The channel has already been broken to the downside.
Russell 2000 U.S. Small Cap Index (click chart to enlarge; IWM, RUT):

Small caps weakening.
3. Gold Market Timing (GLD): Review the issues a few weeks back for an explanation for the abysmal performance of gold. As rates fall again, gold may perk up a bit, but the dollar could rally at the same time, blunting the gains from falling rates. If financial panic ensues, both can rally together. Last week I cited my prior article on gold: “When does gold shine and when does it decline?…Google that phrase and you’ll find it. Read it serveral times, and you’ll know what makes gold move.
The Gold ETF (click chart to enlarge the chart; GLD):

Gold still limping. Waiting for rates to fall more.
4. Interest Rate Market Timing – U.S. 10 Year Treasury Note Yield (TNX):
Rates are falling again having tapped the top of the recent trading range. The trade is now back in the favor of the bond/Treasury Bulls. The speculators looking for rising rates are going to be hurting in my view…
Check out the “Market Signal Summary” below – after you review the following chart…
U.S. 10 Year Treasury Note Yield (click chart to enlarge; TNX, IEF, TYX,TLT,TBF):

Not complicated. Rates topped out at the top of the range and are now falling again.
Now let’s review three key market timing signals together….
Do not use these signals as a trading plan. They are rough guidelines. I currently share my own moves on social media (links above).
MY MARKET SIGNAL AND TREND SUMMARY for a Further U.S. Stock Market Rally with Real GDP Growth (“real” means above inflation):
Stock Signal GREEN for a further U.S. stock market rally with a Bullish SP500 Index trend.
I will change my mind on the trend when the small caps move definitively below the lower yellow line in the small cap IWM chart above. The small caps are a better indicator of the health of the economy, as they are most vulnerable to economic changes, and hence, are the basis for this signal. The VIX (which relates to SPX volatility) closed at 12.12 on Friday vs. 12.07 the previous week. This is still Bullish for the SP500 Index.
Same as last week: What must the VIX do this week? As I said previously: “Any move back above VIX 13.31 again may indicate a developing Bearish trend. A ‘test’ doesn’t count. The last bigger spike was to 16.86, below the two previous spikes in volatility.” The Bears must get through VIX 16.86 to spark a bigger correction. The last little dip to the Sept. 7th low was only 1.73% which is more of a blip than a dip. The Bulls need to take out the lowest VIX targets in the 11’s I shared on social media (links above) to keep the momentum going.
Gold Signal GREEN for a further U.S. stock market rally with a BEARISH Gold Trend.
Remember GLD is being used as an indicator for the ECONOMY here.
Rate Signal NEUTRAL for a further stock market rally with a NEUTRAL 10 Year Yield Trend. I said, “I would be surprised to see a sustained new recent TNX high above 3.115%.” It got to 3.110% and turned down. TNX must fall back below 3.035% to turn Bearish again.
This level of the 10 Year Treasury Yield, which is too high for current conditions as explained HERE, could eventually slow the economy. The market seems to have adjusted to rates of up to 3% or so as said in the signal summary HERE.” A rapid push higher in rates would mean trouble for stocks, as occurred in early 2018.
Note: I’ve updated my criteria for the equity signal for a further U.S. stock market rally to the following: GREEN = Bullish, YELLOW = Neutral, RED = Bearish. In other words, the colors tell you whether the signal supports the stock rally or not, while the Bullish, Neutral, and Bearish designations are about the trend.
NOTE: A BEARISH trend signal does not mean we should not buy. A BULLISH trend signal does not mean you cannot sell some exposure. It depends on what is going on in the economy and how oversold/overbought the market is at a given point whether the Bearish signal is to be sold, sold on the next bounce, etc. and whether a Bullish signal is to be bought or if profits should be taken. A NEUTRAL trend signal does not mean the end of the Bull or Bear. It means to wait and look for possible subsequent entry points within the existing trend, Bull or Bear, but preserve capital if the entry fails. Our strong intention is to buy low and sell high. By the way, I will keep showing the prior orange “Trigger lines” in the charts for now as reference points only; they have historical value for us from the post-2016 election period.
Thank you for reading. Would you please leave your comments below where it says “Leave a Reply”… or ask a question… Pay it forward too by sending the link to MarketTiming.Blog (that link will immediately connect them to this webpage) to a relative or friend. Thanks for doing that.
Be sure to visit the website for more general investing knowledge at:
Standard Disclaimer: It’s your money and your decision as to how to invest it.
I thank Worden Brothers for the charting system I use to post these charts. If you want to know more about the charting system I use every day, go to my “Other Resources” page here: Other Resources It makes it much easier to follow along with me if you can see the charts and manipulate them on your own computer. It’s a great investment to have an excellent charting system. Check it out with a free trial at the link above.
Finally: Please excuse and report all typos if you are so moved. I do my best to pick up most of them, but have not always found them all. Shoot me a comment (I don’t have to post your typo report as I filter them before publication, but I’ll be grateful to you!)
Copyright © 2018 By Wall Street Sun and Storm Report, LLC All rights reserved.
