A Market Timing Report based on the 12-07-2018 Close, published Saturday, December 8th, 2018…
I deliver focused comments on market timing once a week. These are supplemented with daily “Tweets/StockTwits” (see links below).
1. SP500 Index Market Timing (S&P 500 Index®; SPY, SPX):
Two weeks ago I said we need to avoid the “Big Red Wave…”
Let’s review the key challenges that could lead the market down even further or help buoy the market if they work out well. This week we have the resurgence of a lingering risk, now rising in magnitude, for Trump’s impeachment and less likely expulsion from his post.
1. “Data indicating stronger than expected holiday sales would help.” Consumer sentiment is still near all time highs, so the shopping season is not a problem unless the market downdraft has shoppers holding back already. I don’t think that is yet the case, but the volatility around the holidays certainly does not help at the margin, when many businesses do the vast majority of their business during the Christmas buying season. I’ll give this point a check with some concern over high ticket sales coming through as expected.
2. “A Trump Xi agreement with China to avoid 25% tariffs, or better yet, an even more comprehensive agreement within the 90 day period with the clock running since the G20 meeting. Friday, the Trump administration said they could allow for an extension if needed and if progress was being made on coming to an agreement.
The contradictions between Larry Kudlow and Peter Navarro became absurd this past week. The administration needs to speak with one voice. Trump has said he likes chaos, and this certainly fits that pattern. The market very clearly despises chaos of any kind. Send @POTUS a note on Twitter to speak with one voice in the administration! He once called Senator Schumer a “clown.” I evaluate Trump by each thing he does, good or bad. What is going on now in this administration is a “China Trade Clown Act” at best! They need to get a grip and stop the confusion ASAP.
It was reported that President Trump was becoming concerned that he, not Powell, was responsible for the market going down. He considers it his “economic report card,” and the grade for 2018 is a C minus at best with the S&P 500 Index off 10.34% from the intraday high on 9-21-18 and -1.52% since 12-29-17 (YTD). He’s not helping the market for sure, but remember the underlying slowing of growth in the economy (not negative growth, a slowing of the rate of growth) is the more important driver of the stock market downturn in my view. It is always the primary driver behind all the day to day drama, which generates all the up and down volatility.
Nevertheless, trade wars and trade war confusion certainly can make things worse by raising prices as the Fed seeks to control inflation as their primary goal for the first time since the Great Recession. Powell is faced with raising rates to control the component of inflation that is due to the trade war. Powell is oddly “lucky” that the economy is slowing while this trade war is being conducted, which takes pressure off to raise rates as fast as would be otherwise needed.
No check mark on trade!
By the way, I update my market strategy frequently in our Market Timing Room HERE. There is no charge at this time, and you do not have to post any comments if you prefer not to. I suggest you follow me on Twitter as well as on StockTwits as we have had occasional outages on the latter platform of late, in which case I continue to communicate with you on Twitter HERE.
3. U.S. interest rates staying relatively low, but not breaking too low (which hurts financial stocks) would help. As I’ve said, Powell merely indicated in his speech to the New York Economics Club that Fed rates are “just below the broad range of estimates of the level that would be neutral for the economy.”
Chair Powell threw them one bone: Rates MAY be near the lower end of the range of what will serve as a neutral rate. The market was looking for a bone, so it reacted positively to that generating the bounce last Wednesday, which has since dissolved away entirely! More concerning to me was Powell’s continued claim that he and “many private sector economists” are expecting “solid growth” in the U.S. economy in 2019. Solid?
I’ll remind you of what I said last week: “I’ve covered this is prior posts, but the Fed’s own numbers say growth of GDP is supposed to slow substantially into 2019 when GDP will be a mere 2.5% vs. 3.1% this year and by 2020 it will drop to 2.0% and then finally to their long run estimate of “longer run” growth of just 1.8% by 2021. That’s a drop in GDP of 19.4% for 2019 and a drop of 35.5% for 2020 vs. 2018!”
Bottom line? Rates have moved down off the peak of 3.248% in the 10 Year Treasury Yield since Nov. 8th and now look ready to perhaps find support at the summer lows of around 2.80% and bounce. They won’t bounce if we move into the “Big Red Wave” I described two weeks ago HERE. That will drive massive buying of Treasuries, driving rates down even further.
What will the Fed do on December 19th at the end of their next FOMC meeting? The CME Group says the market is now only 71.5% sure the Fed will hike 0.25%, whereas it was above 90% previously. For January, there is a 69.2% probability the Fed will hike, but some of those market participants reflected in that number are from the “no hike in December” group no doubt. There is only a 27.1% probability of TWO hikes by March, which is at the previously assumed pace of Fed hiking, which was one hike of 0.25% in December and one in March.
Those probabilities set up some issues for the market. 1. About 30% of the market is going to be disappointed by a hike in December! Others like Jim Cramer are assuming a near 100% probability they will hike and say the market would fall apart if they don’t. Do you see the problem developing? Volatility around the next few rate decisions is highly likely given the percentage of disappointed investors reflected in these odds.
Then you arrive at the interpretation of the rate hike as good or bad. Is it “bad” if the Fed does not hike? Jim Cramer claimed the market would fall apart without a hike, because it portends bad things for the economy. I don’t buy this.
I believe the market would rally on “no hike in December,” because it will be the clearest recognition that the Fed recognizes the slowing in the global economy is now impacting the U.S. and “going slower” on hikes would be better than risk adding a further drag on the economy and potentially flipping a number of S&P 500 companies into junk bond status, something the Fed has their eye on we are told. The Fed’s FIRST obligation is defending the stability of the financial system including the banks.
I do not believe the market will fall apart given a December hike, as it’s the favored result, but I admit there could be some initial selling around the decision.
4. Oil staying low but not breaking to major new lows that would shut down drilling operations would help.
OPEC and Russia together cut production by 1.2 Billion barrels per reports. Oil did not exactly shoot up in elation after the dust settled, so the jury is still out. Oil below $50 brings risk to oil company debt. Oil “gets a check” with a need to hold the $50ish low.
5. Stability among tech stocks would help. No check there. Tech unlike the SP500 Index is testing its November low, not the higher October low still in play for the S&P.
6. Impeachment and possible Senate trial risk for President Trump. Given the revelations about Trump’s “fixer” and lawyer Michael Cohen on Friday night, the President is likely to be charged with a crime in some fashion. The Justice Department has made it clear they find no legal basis for indicting a sitting President, but this issue could be taken to the courts and would likely end up in the Supreme Court, where Trump has the majority in his favor. The crime could be taken up by the Democratic House in January and serve as the basis of impeachment (we are assuming there was no collusion with Russia, the risk of which was raised by the Cohen filings by the Southern District of New York (the “Billions Office” by the way) and the Special Counsels Office (Mueller)).
If impeachment comes down to the crimes of paying off a Playboy bunny and a porn star, even if it involved a campaign finance violation, I believe it’s highly unlikely a trial to remove President Trump would succeed. He could potentially argue he was just trying to keep the cheating from Melania as some have suggested. The Senate, controlled by the GOP, would conduct the trial at which a 2/3 super-majority of votes is required to remove the President from office. That is highly unlikely to happen unless it can be proven that Russia colluded with Trump directly in breaking into Podesta’s/Clinton’s emails for example. Then he would be out without question.
The other issue is the hotel Trump wanted to build in Russia. IF he made overt promises to the Russians on ending sanctions in order to build a Trump Moscow Tower, he could be out as well, but whether that is actually criminal in nature is not clear. I suspect it is, but claim no legal expertise on the matter. In any case, it seems treasonous if true and would provide a reason for his defeat in a Republican primary battle.
Bottom Line on Impeachment/Trial: It’s become more probable now that Trump will be impeached by the Democrat controlled House. Impeachment over lying alone brought the market down followed by a bounce in Bill Clinton’s case as many of you have read. Here’s that Post on the Clinton Impeachment Market Decline. You can see there what the additional risk could be for the market. It’s a big further drop!
The market would react even more negatively to Trump’s removal from office through a Senate conviction, but that is unlikely if there was no collusion with Russia. The market would then recover as Pence = Trump more or less. If there was DIRECT and obvious collusion by Trump, then even GOP Senators Marco Rubio and Cruz would be forced to convict Trump, and they’d be joined by other Republicans. Trump would be out on the street. But for now, that is all conjecture, so we cannot assign more than a very low risk to the “removal of Trump” scenario.
The market is already on thin ice. We are at a technical level that if violated, could drive further selling and send us into the “Big Red Wave.” The ice often holds when it has to, but Powell is NOT a “put on a bigger market decline.”
If you don’t like the “ifs” in the market, you may want to do something other than follow the markets, because handicapping “ifs” is the nature of the beast. If oil can drop from $75 to $50 from Oct. 3rd to Nov. 23rd, how can you hold the current picture as anything other than that of “Master Market,” the 5 year old temper tantrum throwing child who is equally elated 10 minutes later?
The market game is more like blackjack. You can beat the house, but not if you don’t control your risk and seize opportunity when you see it.
Controlling your risk means lowering your exposure when growth of the economy is slowing and seizing opportunity means buying when markets are down despite the fear, even if your overall exposure is lower. I share my exposure level to equities with you online on social media (links below just above the first chart), which I have not seen anyone else do. They don’t want to be held accountable. My exposure level gives you a feel for how much risk I perceive in the market. Adjust it to your taste, age, and circumstances or ignore it if you disagree. And take responsibility for your decision. You are the one who must be able to sleep at night with your decisions.
If the market bounces, is a review of the possible “Bounce Levels” HERE (scroll down and you’ll see the list).
Remember this guideline on this level and any other level of the market: We can only assess the way the market behaves at any given market level and decide whether the market is stretched to the upside or stretched to the downside. Then we add back exposure at the putative lows and remove some at the putative highs. That is the process I coined the term “Passive Shorting” for and it has been working! Read about it HERE.
Now let’s check in on two “Canary Signals” we’ve been following:
“Intel-igent Market Timing Signal” (Intel; INTC): Negative. Intel turned down about where I thought it would. It now continues to slide down the upper line that forms the down channel it’s in on the daily chart. Only a rise above 50.60 (two closes is safest, but you could attempt to enter sooner with a stop) would change the current picture of a down trend since the June high. (Reminder: INTC was/is our “tell” on 2nd half earnings in tech as noted HERE. We are now closing in on the end of the 4th quarter.)
Bank of America (BAC) Market Timing Signal: Not Negative – Horrendous. BAC outdid the XLF financial Spider ETF this week, which held just above the October low, much like the SP500 Index is doing by the way. BAC cut to a brand new low, below the October low, which is ominous for a bank of this importance. It must recover quickly or the market will be more likely to descend into the “Big Red Wave.” (see link above)
Key Break Points to Avoid the “Big Red Wave” this Week:
- The SP500 Index must hold the 10-29-18 intraday low or thereabouts. Remember, tests of levels often exceed them, and if the test is successful, a bounce ensues.
- Midcaps (IJH) must hold the Oct. low, which was essentially at the level of the February low. The low on Friday was barely above that low. The close was barely above the low for Friday. We’re that close to breaking the ice.
- Small Caps must hold the February low, which they are barely above as of Friday’s close.
- Gold must pull back as rates rise again with the dollar starting Monday. If the moves are the opposite of that, there will be more trouble for stocks. Financials (this time XLF, not just the canary BAC as noted above) will be breaking to new lows and dragging the market down with it.
You see the picture? Mid and small caps are already testing the Feb. lows, while the SP500 Index is testing the October low which lies above the Feb. low. A swoon of the SP500 Index to the February low would bring it 3.81% lower than the Friday close.
Right now the small caps have descended into what I refer to in percentage terms as a Mini Bear Market as defined HERE (scroll to “New Rules”). The losses off the top are now 16.94% for IWM, just above the 15% threshold of my definition. Yes, any drawdown up to 25% would potentially be “OK” and perhaps lead to even higher highs for the market, but if IWM breaks the support mentioned above the next downturn could take it as low as another 6.88% (to 134ish) or to a total decline of 22.65%, approaching the low end of a “Big Bear Market,” as I call a Secular Bear Market. They are the markets of recessions, not drawdowns in a still rising market. “Mini Bear Markets” are the latter.
On December 3rd I told you I sold a “chunk” of midcap exposure. The prior Saturday I asked: “Where is the most obvious place for the stock market to turn down? Right at or slightly above the 50 day mav just as with Bank of America. Notice how it did exactly that once before in November…”
You’ll notice on the chart below that selling the rally on Monday on the false China trade hope was perfect timing. I don’t always buy at the exact bottom or sell at the exact top, but I’m often within a day or two of major moves. It’s very hard to catch every move precisely, as I’m sure you well know. But market timing can be done better than is realized by many. Knock knock….as they say…there but for the grace of God go I. I wake up and do my best every day and seek to improve every single day. That’s all we can ask of ourselves. Do your best and leave the rest is the saying…
I raised my exposure by around 4% (vs. 100% of max exposure) since I dropped it near the Dec. 3rd bounce high. This is just one place the market could hold. There are no guarantees that the iffy points noted above are going to clear and allow the market to rise, even in a bounce. The new closing low in the small caps on Friday, despite being above the Feb. intraday low, is still of concern for risk of more downside.
If I see any of the 3 indexes noted just above breaking down further in the coming week, I will consider dropping my exposure by 5-15%. For reference, I would guess 60% of usual maximum exposure for a Bull market is the lowest I will go. There is risk of being out of the market as I related in the “Big Red Wave” post, but there is also risk of lost opportunity. So I’ll stand by my recent buying of this particular low, but I reserve the right to ditch all that and more if this low does not hold.
I bought SPY and some stocks that are doing better than the overall market, all noted on my feeds on social media. Do your own due diligence on them. I analyze markets and I do not claim to be a stock analyst, unlike some marginal self-proclaimed pundits on TV. Beware of following their advice. Although I do analyze stocks to some extent to satisfy certain criteria, I don’t publish that work.
Stick to the index ETFs if you don’t have the time or inclination to do your own research. My saying I bought stock A should not be enough for you to buy it. That would be ridiculous in my view. You need to go over the data on any stock yourself, listen to at least the last earnings call or two for the stock and look at the technical chart set-up. That would be the minimum. Also realize that you take on more risk and opportunity by holding individual stocks. Balance risk/opportunity in your decisions.
Keep up-to-date during the week at Twitter and StockTwits (links below) where a combined 33,802 investors are following the markets with me…
Follow Me on Twitter® Follow Me on StockTwits®.
SP500 Large Cap Index (click chart to enlarge; SPX, SPY):
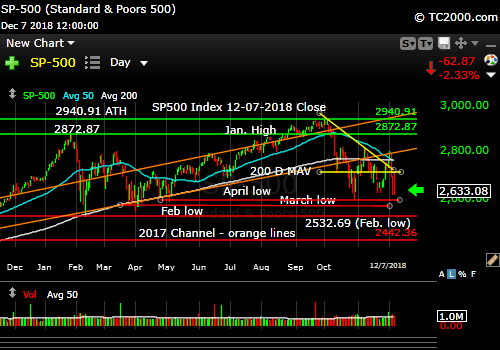
A Market On Thin Ice
Survey Says! Sentiment of individual investors (AAII.com) showed a Bull minus Bear percentage spread of +7.44% vs -5.59% the prior week. Get this: Individual investors became MORE Bullish after the Tuesday 3.24% drop in the SP500 Index! The market promptly dropped another 2.89% the next market day (Thurs.) after GHW Bush’s funeral services. It then bounced and closed down only another 0.15% for the day. Then it fell to Friday’s close, dropping 2.75% vs Thursday’s close.
There still has been not a strong washout of Bullish sentiment from the market. This by itself is a negative.
| AAII.Com Individual Investor Sentiment Poll | ||
| Bulls | Neutrals | Bears |
| 37.94% | 31.56% | 30.50% |
| Thurs. 12 am CT close to poll | ||
2. U.S. Small Caps Market Timing (IWM): I covered the key points above. Both being on thin technical ice and a close at a new closing low vs. the Feb. low is negative. A breach of the Feb. low by small caps would be taken very badly by the overall market unless it was quickly reversed, preferably during the same day as the breach.
Russell 2000 U.S. Small Cap Index (click chart to enlarge; IWM, RUT):
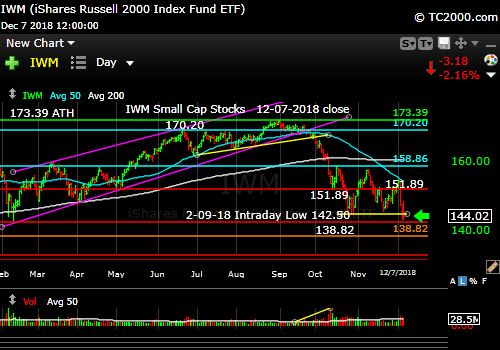
Testing a new closing low vs. the Feb. low.
3. Gold Market Timing (GLD): Gold has finally rallied, just as rates appear ready to bounce. If rates do NOT bounce as mentioned, the stock market will be doing much worse and gold may benefit along with the U.S. dollar due to financial panic. You see, gold goes UP with the dollar when there is financial panic, even if it’s ex-US, but the U.S. is also now subject to panic selling of equities. If rates plunge again next week, gold will continue to rally. I consider it a buy for insurance, but NOT for a trade from this level, because I expect rates to move up from here and the dollar up with it. So for the very short term, I’ll wait to add more GLD.
The Gold ETF (click chart to enlarge the chart; GLD):
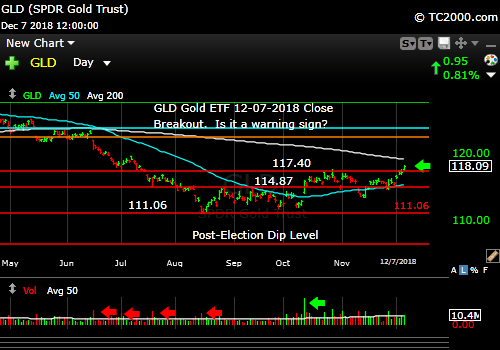
Gold could be a warning sign for stocks, especially if it keeps rising next week.
4. Interest Rate Market Timing – U.S. 10 Year Treasury Note Yield (TNX):
Last week I said: “If they [rates] continue to fall as the stock market rises, beware! That’s not how it is supposed to work in a recovery. It means the recovery is false. It means the stock bounce will be limited.”
My warning on a continued rate decline is noted above. It’s critical that rates bounce early next week, preferable on Monday.
Check out the “Market Signal Summary” below – after you review the following chart…
U.S. 10 Year Treasury Note Yield (click chart to enlarge; TNX, IEF, TYX, TLT, TBF):

Rates falling fast this week crushed financial stocks.
Now let’s review three key market timing signals together….
And just below, I have a “Bonus Chart” this week…
Do not use these signals as a trading plan. They are rough guidelines. I currently share my own moves on social media (links above).
MY MARKET SIGNAL AND TREND SUMMARY for a Further U.S. Stock Market Rally with Real GDP Growth (“Real” means above inflation):
RED RED RED this week. Lots of RED.
Stock Signal RED for a further U.S. stock market rally with a BEARISH SP500 Index trend. (The Signal here is based on the small caps, and I’m sure you know their trend is also Bearish!)
The VIX (which relates to SPX volatility) closed at 23.23 this week , which remains Bearish. But that is still a high VIX. The VIX will need to reclaim 22.97 first and avoid rising above 23.81, which would embolden the Bears in a big way. Next stop for the Bulls below 22.97 would be the VIX up trend line at about 22.54 (as of Fri. close). These numbers change daily. The next Bear target above 23.81 is 25.94 again.
Further VIX Bull Targets: 17.24, 16.86, and 15.94 to create a new recent low. The ‘Bull Nirvana Target’ is our VIX # of the Year: 13.31.”
Four weeks ago I said: “The Bears need to take out the 26ish top that was tested once again this week for the market to go into another leg of decline. If they do it soon, it COULD still just last a day or two.” The high this week? It was 25.94. Close!
As before, VIX 28.84 is the Bear target for Armageddon (another big chunk of losses driving SPX down significantly lower).
Gold Signal RED for a further U.S. stock market rally with a BULLISH Gold Trend. See above for more. If the rally persists, it will be a negative signal for stocks in the near term.
From before: “Remember GLD is being used as an indicator for the ECONOMY here.”
Rate Signal RED for a further stock market rally with a BEARISH 10 Year Yield Trend. The trend is still down. If oil cooperates and moves up a bit, rates could rise again early next week. New lows below that red line just below the current level would be negative for stocks.
As for much higher rates and their possible impact, I said previously: “All heck would break loose for equities if TNX lurches above 3.248%, particularly if the rise is rapid. You buy long dated Treasuries as close as you can to 3.248% on the 10 Year Yield TNX (IEF, TLT, etc.).”
I previously warned about the Fed tightening process: “This level of the 10 Year Treasury Yield, which is too high for current conditions as explained HERE, will eventually slow the economy.”
Sept. 28th issue: “A rapid push higher in rates would mean trouble for stocks, as occurred in early 2018. That’s what I call ‘Rate Shock.'” The period of rising rates in early October was #RateShockII as I called it.
Thank you for reading. Would you please leave your comments below where it says “Leave a Reply”… or ask a question or report a typo…
Pay it forward by sending the link to MarketTiming.Blog (that link will immediately connect them to this webpage) to a relative or friend. Thanks for doing that.
Be sure to visit the website for more general investing knowledge at:
Standard Disclaimer: It’s your money and your decision as to how to invest it.
I thank Worden Brothers for the charting system I use to post these charts. If you want to know more about the charting system I use every day, go HERE. It makes it much easier to follow along with me if you can see the charts and manipulate them on your own computer. It’s a great investment to have an excellent charting system. Check it out with a free trial at the link above. I am an affiliate of Worden Brothers, though oddly I’ve never been paid a cent by them. If you HAVE subscribed to their service, please send me a message. 😉
Note: I’ve updated my criteria for the equity signal for a further U.S. stock market rally to the following: GREEN = Bullish, YELLOW = Neutral, RED = Bearish. In other words, the colors tell you whether the signal supports the stock rally or not, while the Bullish, Neutral, and Bearish designations are about the trend.
A BEARISH trend signal does not mean we should not buy. A BULLISH trend signal does not mean you cannot sell some exposure. It depends on what is going on in the economy and how oversold/overbought the market is at a given point whether the Bearish signal is to be sold, sold on the next bounce, etc. and whether a Bullish signal is to be bought or if profits should be taken. A NEUTRAL trend signal does not mean the end of the Bull or Bear. It means to wait and look for possible subsequent entry points within the existing trend, Bull or Bear, but preserve capital if the entry fails. Our strong intention is to buy low and sell high. By the way, I will keep showing the prior orange “Trigger lines” in the charts for now as reference points only; they have historical value for us from the post-2016 election period.
Copyright © 2018 By Wall Street Sun and Storm Report, LLC All rights reserved.
