A Market Timing Report based on the 01-04-2019 Close, published Sunday, January 6th, 2019…
I deliver focused comments on market timing once a week. These are supplemented with daily “Tweets/StockTwits” (see links below) and comments in the “markettiming” room on StockTwits.
1. SP500 Index Market Timing (S&P 500 Index®; SPY, SPX):
I’ve covered the large number of issues facing the market over the past few weeks (last week’s update with the details is HERE). Let’s go over the issues quickly…
#1 Retail Q4…It was a strong holiday season.
#2 China Trade War…Vice ministerial level talks will start Monday.
#3. Rates…TNX tested 2.621% and then bounced with stocks after Powell said QT would not be on automatic pilot and the Fed would be “patient” on hiking the Fed Funds rate, blah, blah, blah. Yes, it’s just jawboning, because the Fed has no choice but to raise rates with strong employment numbers like those seen last Friday HERE. Don’t get too giddy about Powell. I think that Friday sideshow with Yellen and Bernanke was a bunch of fluff. That’s not being negative; it’s being aware of the Fed mandate. The Fed is not going to be able to avoid hiking rates if wages and employment remain strong.
#4. Global Economic Slowdown…Still trouble for the market and could definitely get worse.
#5. Oil Price Collapse…The bounce has been good, but there is no change in the down trend yet. Global slowing is lurking as an impediment.
#6. Tech Bear Market…XLK is above the Feb. low, a positive, although it fell below it on Thursday and moved back above it on Friday. A further recovery of the tech market would be a big plus for the market, but global economic stats are not encouraging. I remain skeptical that the gains will stick over the short term. Earnings revisions are coming with Q4 earnings, which start soon.
#7. Trump Impeachment/Trial Risk… Rep. Schiff who is now in charge of the House Judiciary Committee won’t pursue impeachment charges as a side show, because it would backfire on the Dems in 2020 to sidetrack the country if the Senate is unwilling to deliver a conviction.
#8. Government Shutdown…Worse this week. President Trump is digging in his heels, and the delay in running the government won’t be helping the economy. I find the entire concept of a shutdown to be a reflection of the idiocy of our two party monopoly on political power. We’ve hired clowns from both sides of the aisle. That aside, a short shutdown won’t matter much, but a long one could matter. It obviously matters to those without paychecks and to those who cannot access government services.
Now let’s check in on two “Canary Signals” we’ve been following:
“Intel-igent Market Timing Signal” (Intel; INTC): Negative, but improved. The bounce is barely above the 50 day moving average.
As said: “Only a rise above 50.60 would change the current picture of a down trend since the June high. (Reminder: INTC was/is our “tell” on 2nd half earnings in tech as noted HERE.) “
Bank of America (BAC) Market Timing Signal: Negative, though it bounced to the top of the down channel. It could stop bouncing at that line or around the 50 day moving average. Bounces like this are not enough to change the down trend. A rise above the July low of 27.63 would be impressive, however.
The bounce this week after the swoon took us barely below the February low. Futures are now trading above that level and a continued move above the Feb. low would be a positive for the Bulls.
The next market goal for the Bulls would include a further rally above the October 29th low. Even then the market could turn down at or just above the 50 day moving average. That pattern, as mentioned for BAC above is typical for a bounce in a Bear market. You can see the other failed bounces in the chart below. This one may be no different. If things change, we change.
Keep up-to-date during the week at Twitter and StockTwits (links below) where a combined 33,802 investors are following the markets with me…
Follow Me on Twitter® Follow Me on StockTwits®.
Join the Conversation in the StockTwits “markettiming” Room
SP500 Large Cap Index (click chart to enlarge; SPX, SPY):
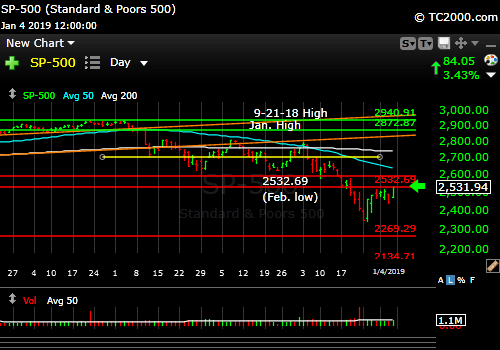
The bounce needs to continue Monday.
Survey Says! Sentiment of individual investors (AAII.com) showed a Bull minus Bear percentage spread of -9.75% vs. -18.75% the prior week. We still have not seen any sort of washout, and we have at least 4 quarters of economic slowing to be reported, including the current quarter with Citigroup (C) reporting on 1-14-19.
| AAII.Com Individual Investor Sentiment Poll | ||
| Bulls | Neutrals | Bears |
| 33.02% | 24.21% | 42.77% |
| Thurs. 12 am CT close to poll | ||
2. U.S. Small Caps Market Timing (IWM): No change: “Not a good place to be until signs of U.S. economic acceleration appear or are anticipated.” Any one of the lines above the current price shown on the chart below could mark the end of the bounce.
Russell 2000 U.S. Small Cap Index (click chart to enlarge; IWM, RUT):
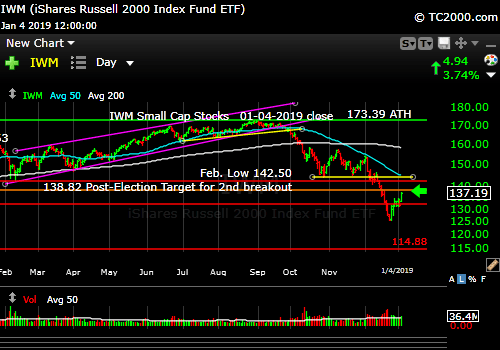
Bear Market Bounce.
3. Gold Market Timing (GLD): Last week I said: “A trading add on pullbacks.” Still true, but buy the pullbacks. I am concerned that rates could move still higher on a further stock market bounce, which will hurt gold.
The Gold ETF (click chart to enlarge the chart; GLD):

In up trend.
4. Interest Rate Market Timing – U.S. 10 Year Treasury Note Yield (TNX):
The bounce Friday was not enough to change the 10 Year Yield down trend back to an up trend.
Still true from two weeks ago: “T*N*X 2.808% is the key level to watch for a reversal back UP.” (the *’s are there so bots cannot read my targets) Note that the down trend line intersects the same number. With a move above there, the current down trend will be under challenge.
If rates start declining again on an immediate basis, watch out because equities will be giving back the recent gains.
Check out the “Market Signal Summary” below – after you review the following chart…
U.S. 10 Year Treasury Note Yield (click chart to enlarge; TNX, IEF, TYX, TLT, TBF):

Rates bounced with stocks on Friday. Must continue.
Now let’s review three key market timing signals together….
Do not use these signals as a trading plan. They are rough guidelines. I currently share my own moves on social media (links above).
MY MARKET SIGNAL AND TREND SUMMARY for a Further U.S. Stock Market Rally with Real GDP Growth (“Real” means above inflation):
Stock Signal RED for a further U.S. stock market rally with a BEARISH SP500 Index trend. (signal here is based on small caps) There is just a bounce in a down trend thus far.
The V*IX (which relates to SPX volatility) closed at 21.38 this week, which is still Bearish though improving. It closed at 28.34 the prior week.
From prior week and other back issues: Further V*IX Bull Targets: 20.34, 18.18 to 18.10, 17.24, 16.86, and 15.95 to create a new recent low. The ‘Bull Nirvana Target’ is our V*IX # of the Year: 13.31.”
The VIX Up Trend Line is at 18.62. The 50 day moving average is 22.30.
Gold Signal RED for a further U.S. stock market rally with a BULLISH Gold Trend. A further GLD rally will be subject to interest rates, which will impact the U.S. dollar. See GLD section above.
From before: “Remember GLD is being used as an indicator for the ECONOMY here.”
Rate Signal RED for a further stock market rally with a BEARISH 10 Year Yield Trend. I said 2 weeks ago, “Watch the oil price too. Higher oil tends to mean higher rates.” Oil is in fact bouncing a bit with rates.
As for much higher rates and their possible impact, I said previously: “All heck would break loose for equities if TNX lurches above 3.248%, particularly if the rise is rapid. Buy long dated Treasuries as close as you can to 3.248% on the 10 Year Yield TNX (IEF, TLT, etc.).”
I previously warned about the Fed tightening process: “This level of the 10 Year Treasury Yield, which is too high for current conditions as explained HERE, will eventually slow the economy.”
Sept. 28th issue: “A rapid push higher in rates would mean trouble for stocks, as occurred in early 2018. That’s what I call ‘Rate Shock.'” The period of rising rates in early October was #RateShockII as I called it.
Thank you for reading. Would you please leave your comments below where it says “Leave a Reply”… or ask a question or report a typo…
Pay it forward by sending the link to MarketTiming.Blog (that link will immediately connect them to this webpage) to a relative or friend. Thanks for doing that.
Be sure to visit the website for more general investing knowledge at:
Standard Disclaimer: It’s your money and your decision as to how to invest it.
I thank Worden Brothers for the charting system I use to post these charts. If you want to know more about the charting system I use every day, go HERE. It makes it much easier to follow along with me if you can see the charts and manipulate them on your own computer. It’s a great investment to have an excellent charting system. Check it out with a free trial at the link above. I am an affiliate of Worden Brothers, though oddly I’ve never been paid a cent by them. If you HAVE subscribed to their service, please send me a message. 😉
Note: I’ve updated my criteria for the equity signal for a further U.S. stock market rally to the following: GREEN = Bullish, YELLOW = Neutral, RED = Bearish. In other words, the colors tell you whether the signal supports the stock rally or not, while the Bullish, Neutral, and Bearish designations are about the trend.
A BEARISH trend signal does not mean we should not buy. A BULLISH trend signal does not mean you cannot sell some exposure. It depends on what is going on in the economy and how oversold/overbought the market is at a given point whether the Bearish signal is to be sold, sold on the next bounce, etc. and whether a Bullish signal is to be bought or if profits should be taken. A NEUTRAL trend signal does not mean the end of the Bull or Bear. It means to wait and look for possible subsequent entry points within the existing trend, Bull or Bear, but preserve capital if the entry fails. Our strong intention is to buy low and sell high. By the way, I will keep showing the prior orange “Trigger lines” in the charts for now as reference points only; they have historical value for us from the post-2016 election period.
Copyright © 2019 By Wall Street Sun and Storm Report, LLC All rights reserved.
