A Market Timing Report based on the 01-11-2019 Close, published Sunday, January 13th, 2019…
I deliver focused comments on market timing once a week. These are supplemented with daily “Tweets/StockTwits” (see links below) and comments in the “markettiming” room on StockTwits.
1. SP500 Index Market Timing (S&P 500 Index®; SPY, SPX):
I’ve covered the large number of issues facing the market over the past few weeks. I count an additional ninth thorn in the market’s side this week!
Let’s go over the issues quickly…
#1 Retail Q4…It was a strong holiday season; however, last week’s results for brick and mortar stores were mostly weak with Macy’s stock down over 20% from the 1-09-19 close! Amazon warned on its own Q4 guidance in its Q3 earnings report, and it could have taken share away from brick and mortar and end up beating guidance. Overall, the initial reactions in the retail sector are a negative report on the consumer.
#2 China Trade War…Vice ministerial level talks occurred Monday through Weds. of last week. The Wall St. Journal says “Vice Premier Liu He is planning to meet with his U.S. counterparts including U.S. Trade Rep. Robert Lighthizer and Treasury Secretary Steven Mnuchin for negotiations on Jan. 30 and Jan. 31…” It was also reported by them that the shutdown could delay those talks. The initial assessment of progress was lukewarm at best, so this is still an unresolved thorn in the side of the market with Jim Cramer reporting that Chinese consumers are avoiding the purchase of American products in protest.
#3. Rates…TNX tested below 2.621% and then bounced with stocks after Powell’s jawboning to a lower high, but now appear to be moving down again. I repeat from past weeks: “The Fed is not going to be able to avoid hiking rates if wages and employment remain strong.” On the other hand, global slowing can push rates down lower with the Fed having to ease rates eventually. With these opposing forces, we must follow the trend, which is still down. That’s why I added to my Treasury holdings last week and sold stock exposure.
#4. Global Economic Slowdown…Still trouble for the market and could definitely get worse. The Europe and China slowing are both getting worse.
#5. Oil Price Collapse… The bounce could fail without a move through 54.50ish to the upside. Global economic slowing means lower demand.
#6. Tech Bear Market…XLK is still above the Feb. low, a positive, but it’s hesitating just above 63.38. It still could be a sloppy test of the Nov. low to be followed by the next wave down. The tech market must continue its rally on Monday. If it does not, watch out below.
#7. Trump Impeachment/Trial Risk… Rep. Schiff, as far as I’m aware, is still hesitant to make a move on Trump without Mueller’s report providing hard evidence. The Mueller Surprise factor is a possible threat to the stock market over the short to intermediate term. The policy reversals of electing a Democratic President in 2020 BECAUSE of the Trump Russia issue are the real threat to markets. More on that in a bit…
#8. Government Shutdown…Worse this week. The Trump Shutdown, branded by him as such publicly, is now the longest government shutdown ever recorded. How do you handicap something that is the longest ever with old data? Hmm?
A few more days won’t matter, but a few more weeks will hurt GDP for Q1. It also hurts many innocent government workers employed by an incompetent government.
#9 Joe Biden Presidency: Remember, all the gains made on tax policy could be reversed after the 2020 election by a President Joe Biden, unless the Democrats pick an extremist candidate such as Elizabeth Warren or an untested candidate like Sen. Kamala Harris. Trump would love to run against either of them or any other McGovern type of Democrat in 2020. (Please note these comments are a process of handicapping the election in investment terms. I don’t like either party and what they’ve BOTH done to destroy the U.S. dollar over the years.)
I think Biden knows the country would not be easily convinced that someone like Elizabeth Warren would make a great Commander In Chief. Biden’s been around the block in his 8 years of VP service. Warren and Harris lack the credentials of a Hillary Clinton, who as Sec. of State, was at least involved in the discussions about the Middle East conflicts.
Biden would rule from a point near the middle as Obama largely did, despite fears of him being a socialist. Obamacare was the closest he got to a socialist agenda. It was a partial victory for him with negative consequences for the party due to the problems it created. The millionaire tax was part of that, but mostly the Clinton tax rates were reinstated after the deficit busting “tinkle down” tax cuts by Pres. G.W. Bush.
The market will start to grow nervous about losing the regulatory and tax gains of the Trump administration especially by the end of 2019 if there is a viable Democrat candidate. Biden NOT running would reassure the markets.
I admit that Bernie Sanders is a wild card, as he could win based on his prior strong run against Hillary in a party dominated selection process. He’s only one year older that Biden, so if Biden can run, so can Bernie. They may both say they’ll serve one term to convince voters not to worry about their age.
Tangential Story: I only half joke that Bernie Sanders saved my life after we had a cordial debate on healthcare in the middle of a 50 MPH road that runs into Burlington, Vermont. He was standing on a narrow meridian and I joined him there prior to his first victory in running for the House of Representatives. As I turned to cross the road, I nearly walked into an oncoming car. Thanks Bernie! 😉
A Bernie Sanders win as a self-proclaimed Socialist would be very tough on the stock market in my view. The market could begin selling off early if Sanders takes an early lead against Biden. Biden, in the meantime, has yet to declare his intention to run.
Now let’s check in on two “Canary Signals” we’ve been following:
“Intel-igent Market Timing Signal” (Intel; INTC): Stronger. Now re-topping near the 200 day moving average.
BUT as said: “Only a rise above 50.60 would change the current picture of a down trend since the June high. (Reminder: INTC was/is our “tell” on 2nd half earnings in tech as noted HERE.) “
Bank of America (BAC) Market Timing Signal: Negative, although it is now essentially at the top of the down channel. It could stop bouncing right here or around the 50 day moving average. Prior comment: Bounces like this are not enough to change the down trend. A rise above the July low of 27.63 would be impressive, however.
Last week: “The next market goal for the Bulls would include a further rally above the October 29th low.” That’s where the market seemed to stop last week. Even then, the market could rally a bit higher and turn down at or just above the 50 day moving average. That pattern is typical for a bounce in a Bear market.
Earnings are out in force over the next few weeks, so watch for revisions up or down. Stay with the best companies with the best prospects for accelerating growth. Any company that can accelerate their earnings and revenue growth while the rest are slowing will be an outright winner. This is not new news. But it’s what we should focus upon!
Keep up-to-date during the week at Twitter and StockTwits (links below) where a combined 33,829 investors are following the markets with me…
Follow Me on Twitter® Follow Me on StockTwits®.
Join the Conversation in the StockTwits “markettiming” Room
SP500 Large Cap Index (click chart to enlarge; SPX, SPY): OBVIOUSLY it was from the 2019 close!

Lower high forming or are the Bulls looking for more?
Survey Says! Sentiment of individual investors (AAII.com) showed a Bull minus Bear percentage spread of +9.09% vs. -9.75%. There has been no washout of Bulls in this data. Investors are still afraid of missing out on gains in the bounces. Until that dissipates, the final low is not likely in. The prior low will at least be retested in my view.
| AAII.Com Individual Investor Sentiment Poll | ||
| Bulls | Neutrals | Bears |
| 38.46% | 32.17% | 29.37% |
| Thurs. 12 am CT close to poll | ||
2. U.S. Small Caps Market Timing (IWM): No change: “Not a good place to be until signs of U.S. economic acceleration appear or are anticipated.” The 50 day moving average looks like a pretty good spot for the rally to end in small caps. A move higher would be impressive, and could embolden the Bulls further. The slowing in the economy stands in the way of ANY rally working out in my opinion. These are still places to “sell some” until the economic numbers accelerate again.
Russell 2000 U.S. Small Cap Index (click chart to enlarge; IWM, RUT):

Same pattern. Bounce to a lower high.
3. Gold Market Timing (GLD): Last week I said: “A trading add on pullbacks.” Still true, but only buy the pullbacks rather than “chase,” unless you have no gold exposure. Then you could average in some here and hold back cash to add higher or lower. Rates may have topped for now, which will help gold.
The Gold ETF (click chart to enlarge the chart; GLD):

Gold pause. Then what? Watch the US dollar and rates.
4. Interest Rate Market Timing – U.S. 10 Year Treasury Note Yield (TNX):
The trend in rates is still DOWN. 2.717% is now the immediate upside target. The market now believes the Fed is going to move even more slowly to raise rates (right or wrong). That means if rates actually RISE instead of fall, the market will have a problem! Stocks will sell off again.
If rates fall too quickly, it will signal a lack of confidence in the U.S. economy and a switch of assets from stocks into Treasuries/dollars.
Check out the “Market Signal Summary” below – after you review the following chart…
U.S. 10 Year Treasury Note Yield (click chart to enlarge; TNX, IEF, TYX, TLT, TBF):
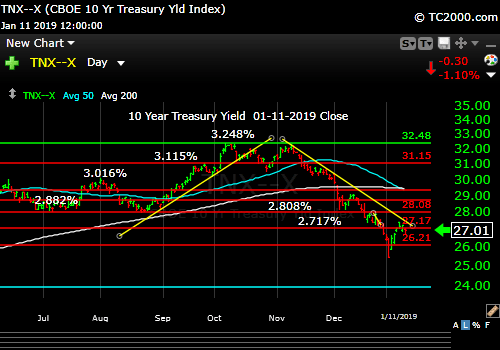
Rates could now be moving down again.
Now let’s review three key market timing signals together….
Do not use these signals as a trading plan. They are rough guidelines. I currently share my own moves on social media (links above).
MY MARKET SIGNAL AND TREND SUMMARY for a Further U.S. Stock Market Rally with Real GDP Growth (“Real” means above inflation):
Stock Signal RED for a further U.S. stock market rally with a BEARISH SP500 Index trend. (signal here is based on small caps)
The V*IX (which relates to SPX volatility) closed at 18.19, down from 21.38 last week. It broke the up trend line which is Bullish for stocks, but this was after making a higher high in December. I am now watching the behavior of the VIX should it approach the major lows from Oct. to Dec.
From prior week and other back issues: Further V*IX Bull Targets: TESTING THIS NOW: 18.18 to 18.10, then 17.06, 16.09, and 15.94 to create a new recent low. The ‘Bull Nirvana Target’ is our V*IX # of 2018: 13.31.”
The VIX Up Trend Line is at 19.50ish. The 50 day moving average is 21.91.
Gold Signal RED for a further U.S. stock market rally with a BULLISH Gold Trend. A further GLD rally will be subject to interest rates, which will impact the U.S. dollar.
From before: “Remember GLD is being used as an indicator for the ECONOMY here.”
Rate Signal RED for a further stock market rally with a BEARISH 10 Year Yield Trend. I said 2 weeks ago, “Watch the oil price too. Higher oil tends to mean higher rates.” Oil is in fact bouncing with rates, but has reached a level it could pull back from.
As for much higher rates and their possible impact, I said previously: “All heck would break loose for equities if TNX lurches above 3.248%, particularly if the rise is rapid. Buy long dated Treasuries as close as you can to 3.248% on the 10 Year Yield TNX (IEF, TLT, etc.).”
I previously warned about the Fed tightening process: “This level of the 10 Year Treasury Yield, which is too high for current conditions as explained HERE, will eventually slow the economy.” 2.621% was the peak back in 2017 when stocks did best. Anything below that would be an improvement. That level was tested and rates bounced. 2.554% was the recent low.
Sept. 28th issue: “A rapid push higher in rates would mean trouble for stocks, as occurred in early 2018. That’s what I call ‘Rate Shock.'” The period of rising rates in early October was #RateShockII as I called it.
Thank you for reading. Would you please leave your comments below where it says “Leave a Reply”… or ask a question or report a typo…
Pay it forward by sending the link to MarketTiming.Blog (that link will immediately connect them to this webpage) to a relative or friend. Thanks for doing that.
Be sure to visit the website for more general investing knowledge at:
Standard Disclaimer: It’s your money and your decision as to how to invest it.
I thank Worden Brothers for the charting system I use to post these charts. If you want to know more about the charting system I use every day, go HERE. It makes it much easier to follow along with me if you can see the charts and manipulate them on your own computer. It’s a great investment to have an excellent charting system. Check it out with a free trial at the link above. I am an affiliate of Worden Brothers, though oddly I’ve never been paid a cent by them. If you HAVE subscribed to their service, please send me a message. 😉
Note: I’ve updated my criteria for the equity signal for a further U.S. stock market rally to the following: GREEN = Bullish, YELLOW = Neutral, RED = Bearish. In other words, the colors tell you whether the signal supports the stock rally or not, while the Bullish, Neutral, and Bearish designations are about the trend.
A BEARISH trend signal does not mean we should not buy. A BULLISH trend signal does not mean you cannot sell some exposure. It depends on what is going on in the economy and how oversold/overbought the market is at a given point whether the Bearish signal is to be sold, sold on the next bounce, etc. and whether a Bullish signal is to be bought or if profits should be taken. A NEUTRAL trend signal does not mean the end of the Bull or Bear. It means to wait and look for possible subsequent entry points within the existing trend, Bull or Bear, but preserve capital if the entry fails. Our strong intention is to buy low and sell high. By the way, I will keep showing the prior orange “Trigger lines” in the charts for now as reference points only; they have historical value for us from the post-2016 election period.
Copyright © 2019 By Wall Street Sun and Storm Report, LLC All rights reserved.

Thank you David!
You are welcome Charles!