A Market Timing Report based on the 02-22-2019 Close, published Sunday, February 23rd, 2019…
I deliver focused comments on market timing once a week. These are supplemented with daily “Tweets/StockTwits” (see links below) and comments in the “markettiming” room on StockTwits.
UPDATE on China (2-25-19 10:10 am): KBA (China A Share ETF) is now above the prior 2016-2017 consolidation band (top line of that is the horizontal red line). It is testing a breakout with some still claiming the stimulus China is using is too small to make enough of a difference to stop the slowing trend in their economy (yes, it’s acceleration that matters, not “growth” alone in determining valuations per Ray Dalio).
IF the trade deal is only good for the U.S. short term and long term (Trump claims its good for both countries, but we’ll see), and only good for China longer term, this trend could change quickly. That’s the risk. China wants “in” in terms of being a big boy/girl on the world financial scene (it’s a toddler so far, but wants to be an adult). To do that, it has to follow patent rules etc. to protect its own scientists and engineers, and not force U.S. companies to give up their secrets to do business in China (forced tech transfer). Plus they will have to employ more Americans to make their products for U.S. markets as the Japanese do, although I’ve heard nothing like that other than Alibaba saying it will hire Americans in 2019. If the deal is more U.S. sided in the short term, it could cause short term pain that may haunt the Chinese stock market.
Let’s let the market guide us! Follow me on social media to see when I start biting harder on the China trade. No guarantees as the above indicates, but the market often leads reality…
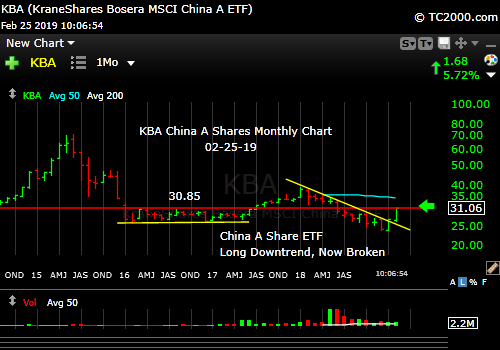
China trend turning? Close!
Now back to this week’s important issue….
1. SP500 Index Market Timing (S&P 500 Index®; SPY, SPX):
The Bull still lives, but looks tired. This past week was a continuation of the prior uptrend in U.S. stocks, but at a slower pace. Let’s review the current market risks…
China Deal Risk: The market is tired of the Bullish China Trade Deal narrative. Anything that does not impact U.S. GDP in a very real and big way will be a disappointment. If we smell a rat of a deal with China in the Year of the Rat by the way, the market will not like it. It could fall right away.
But get this Mr./Mrs/Ms. Bull: If it is a strong deal in GDP growth terms (or a true Trumpian “big, beautiful, amazing deal,” there would be a reason to expect economic activity to accelerate. Then watch out for 3-5% upside on a single trading day and a continuing uptrend. Is President Trump bringing the GDP bacon home from China or not?
For China watchers, realize this deal could HURT China short term and help them long term. If so, the Chinese market could DROP in the short term on a deal with the U.S. Reporters need to get at the net economic impact on both China and the U.S.
Mueller Risk: Other current risks include Mr. Mueller’s report, which if it leads to a Trump impeachment (not a given), could send the markets int0 a tailspin (from which it would recover, but it would take a while in my view).
2020 Election Risk: Like it or not, the biggest risk to the market is the election of a liberal Democrat like Bernie Sanders (said as a confirmed independent). He will go after “wealth” in many different ways, and bring a wrecking ball to estate plans already made. Above 3.5 M, he’ll take a big chunk of every estate for the governments coffers. Election years are a nervous time for markets, precisely because they do not know what to expect. Few expected Trump to win, yet here he is….
The coming election for the Democrats is about “sweet revenge.” They will not coast into 2020 as Hillary Clinton did. They will go on the stump throughout the Midwest too, unlike Hillary. Look for market turbulence (7-15% down market move or two) in late 2019 to 2020. If Democrats put up a newbie, far left liberal like Kamala Harris (seems from appearances like a good person, but definitely green and far left), Trump will have a good shot at winning again. I am giving you my view of the risks, not an opinion on how much you should like/dislike given candidates. Politics matter big-time!
Fed Rate Hike Risk: thoroughly covered for weeks now, and quickly reviewed in the rate section, #4, below… With the market already in full recovery as the Fed would view it, the risk of a rate hike is HIGHER now in my view.
Let’s get back to the technical picture…
The Dow, which I do not regularly follow (though the media loves it by tradition), has moved above two of the three lower highs in Oct., Nov, and Dec., respectively, not to mention it’s up NINE full weeks in a row. That is a 19.45% return off the Dec. 24th closing low, a bit better than the SP500 Index’s 18.78%. That is a big return in a short period of time.
If the market’s YTD return is replicated for the rest of the year, the annual return would be 129.33% for the SP500 Index. Do you believe that is likely?
Despite the Dow’s success in rising above 2/3 targets, the Dow Transports, remain below all three, which means the Dow “Buy” signal is unconfirmed in Dow Theory terms. The same is true for the S&P 500 Index. It is within spitting distance of the December high as the chart shows, and that is its first goal. In my view, it would have to scale all THREE highs of Oct. 17 2816.94, Nov. 7, 2815.15, and Dec. 3 2800.18, the latter just 8 points away, before saying the Mini Bear Market is dead.
Even with that, it is theoretically possible of course, for the market to retop yet again and then fall apart as the first recession in over a decade begins. The problem with that? Recession is not in the data according to some of the most Bearish firms out there. The argument that any period of time is “too long,” is a dumb argument. History repeats itself in very rough form, but the so-called experts can be years too early with a call for a recession based on history.
This is considered a slowing period, not slowing headed to recession, though there are never guarantees trends cannot snowball in a bad way. Inflation would be one way for trouble to break out, and it is due to rise slightly over the next few quarters. Still, the predicted acceleration in inflation (second derivative; simple calculus) is not enough to take the markets down by itself.
The market appears to be discounting an entire 4 quarters of slowing including the one it’s already looked past, which is Q4 of 2018. There are now three more quarters of unpleasant results to look past, although you all know the big secret don’t you? The analysts lower their estimates and then when earnings come out, the company beats them, and then the media proclaims “They’re better than expected!” And the stock goes up.
For the SP500 Index, there are FOUR more quarters of earnings slowing to contend with despite recovery for 6 of 11 sectors from their slump in Q4 2019 as I pointed out last week HERE.
GDP RISK: Finally, drum-roll please, the government shut down GDP reporting for Jan. 28th, and that means it will be released on Feb. 28th, which is this coming Thursday. Better be awake on Thursday, and watch the response of the market after the 8:30 am ET report on Q4 GDP. Is a horrible number close to the Atlanta Fed’s estimate going to rule the day or will it be closer to the NY Fed’s higher number? (both numbers are cited on my social media streams)…
Now take a look at the SP500 chart, and then we’ll review the earnings data, which are now 89% reported…. Orange lines are the 2017 up channel.
SP500 Large Cap Index (click chart to enlarge; SPX, SPY):
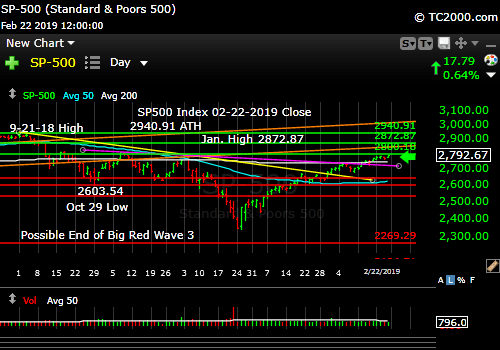
Is the Bear market over or is this one of the greatest Bull Traps of all time?
This week, earnings predictions are even worse, while revenues are holding up after the prior week’s drop. The full FactSet report is HERE.
These are the SP500 Index Earnings and Revenue growth (or lack thereof) numbers predicted as of the Feb. 2nd vs. the Feb. 15th vs. the Feb. 22nd close, from left to right…
“For Q1 2019, analysts are projecting a decline in earnings of -0.8% -> -2.2% -> -2.7% and revenue growth of 5.7% -> 5.3% -> 5.2% .
For Q2 2019, analysts are projecting earnings growth of 1.6% -> 1.0% -> 0.7% and revenue growth of 5.1% -> 4.7% -> 4.7%.
For Q3 2019, analysts are projecting earnings growth of 2.7% -> 2.4% -> 2.2% and revenue growth of 4.9% -> 4.5% -> 4.5%.
For Q4 2019, analysts are projecting earnings growth of 9.9% -> 4.8% -> 4.5% and revenue growth of 6.0% -> 4.9% ->4.9%.”
This deterioration “should” put the breaks on the market prior to making new highs (for SP500 Index) above those three prior lower highs given above.
If not, the market will be sending a strong message (right or wrong) it intends to move still higher. And as you’ll see below, sentiment is not yet in the way of a further rally….
Now let’s check in on two “Canary Signals” we’ve been following:
“Intel-igent Market Timing Signal” (Intel; INTC): Very positive, but I don’t like the possible setup for an island reversal (Google it please). Hold it if you own it now, but protect your profits if the trend reverses. As long as it stays above 50*60 (* vs. . used to throw off web crawlers!), the breakout is intact. If you see a big reversal Monday, however, the run could be over for INTC.
For now, the uptrend in Intel is intact…
Bank of America (BAC) Market Timing Signal: Negative. It looks this week as though it’s forming another slightly lower high off a top.
Remember the problem for the entire market:
- If the economy is getting better (it’s slowing, but expected to pick up in multiple sectors by year end), rates generally should rise, at least over the short term, not fall.
- The market believes the Fed will go slower on hiking rates, because the global economy is slowing! That means rates would fall, not rise.
- Financials’ lifeblood is the rate spread between their cost of money vs. their customer’s cost. They make more money with higher rates vs. lower rates, not to mention the fact that many instruments out there guarantee 3-5% interest by contract. Low rates are a big problem for the industry.
- A strengthening economy is the other key for financials. It means more competition for their money, so they can charge more to customers expanding their businesses. The global economy is slowing, and so is the U.S. economy. No help here!
One reason for the pause in BAC is the 10 Year Yield is pausing also. Remember that IF rates rise from here rather than fall as the bond market expects (at least the media does from their Fed comments), financials will get a bit of a boost.
I will discuss rates further below, and you need to read it. Remember two of the last negative moves in the market were due to rates rising faster than the stock market liked. Rates going up slowly is good for financials, but rates going up rapidly is bad for the entire stock market. The “Rate Game” is more complicated than meets the eye!
Now let’s go on to review investor sentiment and why that could be of help…
Keep up-to-date during the week at Twitter and StockTwits (links below) where a combined 33,889 investors are following the markets with me…
Follow Me on Twitter® Follow Me on StockTwits®.
A Heads Up… This week I covered in the “Room” (link just above), why you must manage your cash properly! You should be making at least 2.3% on your cash. If you are making less, you have gone to sleep on your cash. Bad idea, because it hurts your overall return. Click the link just below to find out more…(but don’t forget to read the rest of this issue!)…
Join the Conversation in the StockTwits “markettiming” Room
Survey Says! Sentiment of individual investors (AAII.com) showed a Bull minus Bear percentage spread of +13.93% vs. +10.03%. The Bear # did not budge. The Bulls are not maxed out here. Recent highs in sentiment have been around 20. This means there is still room for the market to rise. Investors are becoming a bit less fearful each week, which helps sustain the rise. When everyone is cheery again, watch out, because the next dip/correction will hit the fan.
| Bulls | Neutrals | Bears |
| 39.32% | 35.29% | 25.39% |
| Thurs. 12 am CT close to poll | ||
2. U.S. Small Caps Market Timing (IWM): Still climbing, now with less than 10% upside to the all time high (ATH). Remember this is a higher beta index than the SP500, so the swings down will be bigger – if the market ever goes down again. 😉
Russell 2000 U.S. Small Cap Index (click chart to enlarge; IWM, RUT):
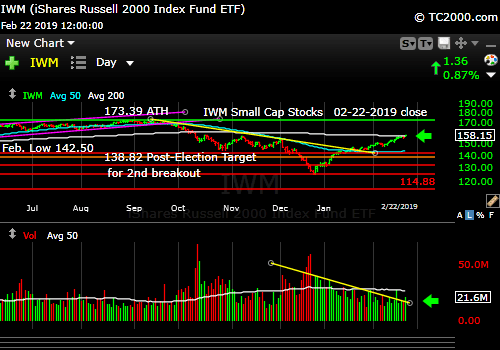
Less than 10% from the top.
3. Gold Market Timing (GLD): I bought covered calls on a gold mining company this week (Bought the stock and sold calls against it to generate a 13.7% simple annualized return). (If you want access to my private picks, email me using the contact box on this site. If there are enough of you, I may be able to arrange discounted access. Thanks.) My exposure to metals via GLD/GDX/miners is now 5.3% of investable assets (rounded to 0.1%). 5% is often recommended, though I’ve never heard anyone say whether their 5% was vs. investable assets, or all assets including one’s house. Adjust to taste! If you have a lot of money in real estate, you may need less metal exposure for example, although real estate is obviously less liquid in a pinch.
Realize any big jump in interest rates could knock down our profits. At some point, protect your profits as it’s been a good trade, but be willing to get back in if you are wrong on any exit. Read the summary blurb at the bottom on gold to understand that the success of gold could be a warning sign for the U.S. stock market…
The Gold ETF (click chart to enlarge the chart; GLD):
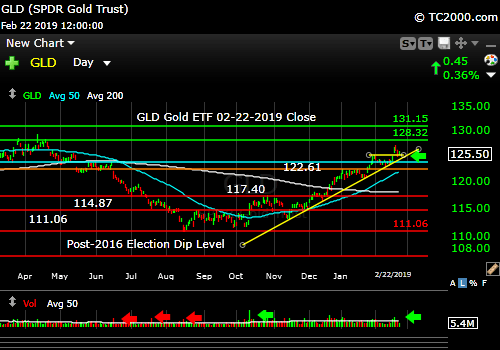
Gold uptrend intact.
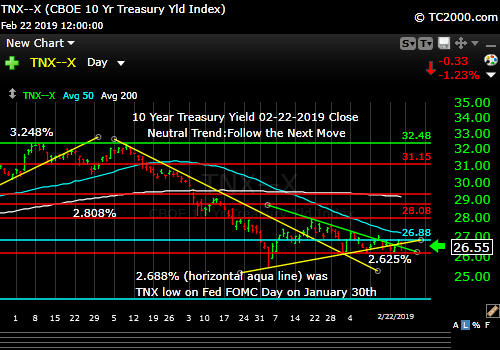
4. Interest Rate Market Timing – U.S. 10 Year Treasury Note Yield (TNX):
Last week’s comments still hold. Rates are in a holding pattern despite the fact that per every guru on Wall Street, Powell and the Fed have turned into full fledged doves, and many believe the Federal Reserve won’t hike this year!
If so, why are rates barely lower than when they concluded that, which was at a TNX of 2.688%? SOMEONE IS WRONG ON RATES! That is why I’m standing clear until I see the next big move, and sticking with short term Treasuries (see last week’s post on what I actually did!).
When rates make their next move, you may be able to make some money by following the bouncing ball… On the chart below, TNX is barely above that green down trend line. It’s also below the uptrend line in yellow. Resolution? Follow the move…
Check out the “Market Signal Summary” below – after you review the following chart…
U.S. 10 Year Treasury Note Yield (click chart to enlarge; TNX, IEF, TYX, TLT, TBF):
Rates are going to make a move soon!
Now let’s review three key market timing signals together….
Do not use these signals as a trading plan. They are rough guidelines. I currently share my own moves on social media (links above).
MY MARKET SIGNAL AND TREND SUMMARY for a Further U.S. Stock Market Rally with Real GDP Growth (“Real” means above inflation):
Stock Signal GREEN for a further U.S. stock market rally with a Bullish SP500 Index trend. (signal here is based on small caps)
The V*IX (which relates to SPX volatility; * added to symbol to throw off the webcrawlers!) closed at 13.51 vs. 14.91 last week.
The Bulls have made tremendous progress and these targets are now targets for the Bears: 14.04-14.08, 15.04, 15.94-15.95, 16.09, 17.06, 17.27, and 17.89 (UPDATED 2-22-19). The Bulls are approaching a big Bullish number….
The ‘Bull Nirvana Target’ is our V*IX # of 2018: 13.31.”
Gold Signal RED for a further U.S. stock market rally with a BULLISH Gold Trend. A further GLD rally will be subject to interest rates, which will impact the U.S. dollar as explained above. Gold can run up with stocks as it did from 2003 to 2007 and then again from 2009 to 2011. But what it does mostly as I’ve written HERE is follow real interest rates. If we see rates break lower, gold will keep trending up. If not, there will be trouble ahead for all metals.
From before: “Remember GLD is being used as an indicator for the ECONOMY here.” If gold continues to rise, it means the market believes real rates will fall, which means the global economy is slowing. That would hurt U.S. stocks.
Rate Signal NEUTRAL for a further stock market rally with a NEUTRAL 10 Year Yield Trend. Follow the move out of the triangle.
I said weeks ago, “Watch the oil price too. Higher oil tends to mean higher rates.” Oil made another higher high this week, so I continued buying oil stock exposure (…on the social media stream! Links above.).
I previously warned about the Fed tightening process: “This level of the 10 Year Treasury Yield, which is too high for current conditions as explained HERE, will eventually slow the economy.” I said, “2.621% was the peak back in 2017 when stocks did best. Anything below that would be an improvement.” The close on Friday? 2.655%!
As for much higher rates and their possible impact, I said previously: “All heck would break loose for equities if TNX lurches above 3.248%, particularly if the rise is rapid. Buy long dated Treasuries as close as you can to 3.248% on the 10 Year Yield TNX (IEF, TLT, etc.).” In the Sept. 28th issue: “A rapid push higher in rates would mean trouble for stocks, as occurred in early 2018. That’s what I called ‘Rate Shock.'” The period of rising rates in early October was #RateShockII as I called it.
Thank you for reading. Would you please leave your comments below where it says “Leave a Reply”… or ask a question or report a typo…
Pay it forward by sending the link to MarketTiming.Blog (that link will immediately connect them to this webpage) to a relative or friend. Thanks for doing that.
Be sure to visit the website for more general investing knowledge at:
Standard Disclaimer: It’s your money and your decision as to how to invest it.
I thank Worden Brothers for the charting system I use to post these charts. If you want to know more about the charting system I use every day, go HERE. It makes it much easier to follow along with me if you can see the charts and manipulate them on your own computer. It’s a great investment to have an excellent charting system. Check it out with a free trial at the link above. I am an affiliate of Worden Brothers, though oddly I’ve never been paid a cent by them. If you HAVE subscribed to their service, please send me a message. 😉
Note: I’ve updated my criteria for the equity signal for a further U.S. stock market rally to the following: GREEN = Bullish, YELLOW = Neutral, RED = Bearish. In other words, the colors tell you whether the signal supports the stock rally or not, while the Bullish, Neutral, and Bearish designations are about the trend.
A BEARISH trend signal does not mean we should not buy. A BULLISH trend signal does not mean you cannot sell some exposure. It depends on what is going on in the economy and how oversold/overbought the market is at a given point whether the Bearish signal is to be sold, sold on the next bounce, etc. and whether a Bullish signal is to be bought or if profits should be taken. A NEUTRAL trend signal does not mean the end of the Bull or Bear. It means to wait and look for possible subsequent entry points within the existing trend, Bull or Bear, but preserve capital if the entry fails. Our strong intention is to buy low and sell high. By the way, I will keep showing the prior orange “Trigger lines” in the charts for now as reference points only; they have historical value for us from the post-2016 election period.
Copyright © 2019 By Wall Street Sun and Storm Report, LLC All rights reserved.

Great bloog
I’m going to call the market sustained move higher the Trump trade! Not withstanding the Mueller report that may be bad for the president and the markets! The business community loves Trump and will do anything to drive up stock prices into the election 2020 so we could see a continuation of gains from here! My Passive Shorting process worked beautifully so I don’t need to be greedy here! The best gains in January for me ever! I believe it will be a bull trap and I’m staying with my process to buy low and sell high as I sit in cash now at 95% as of Friday last week earning 3.4%. I have four years to retirement so I want be gambling big anymore. I will buy meaningful dips or pullbacks for a trade using 40% of cash! Thank you David!
You are welcome Charles.