A Market Timing Report based on the 03-01-2019 Close, published Saturday, March 2nd, 2019…
I deliver focused comments on market timing once a week. These are supplemented with daily “Tweets/StockTwits” (see links below) and comments in the “markettiming” room on StockTwits.
1. SP500 Index Market Timing (S&P 500 Index®; SPY, SPX):
The Bull is in “tired mode.” The small caps (IWM) have gone sideways for the past 6 trading days and have barely moved up for 8 trading days. For the SP500 Index, it has been 5 days flat. Now a review of the current risks to the market…
China Deal Risk: There is going to be a “big, beautiful deal” after all, we are told. What we still don’t know whether it will substantially boost U.S. GDP and hurt China by raising their import costs, or be of net benefit to China by opening up our markets even more to them. I cannot imagine China is going to be the net GDP winner on this on in terms of the import/export component of GDP, as the whole point of the talks is to improve the situation for the long “ripped off” U.S. I do expect China will benefit despite its bad behavior in the past as, for example, it has a huge AI effort underway that needs patent protection as much as our work in the U.S. does.
Chinese capital markets will get a huge infusion as they are included in the MSCI Indexes as has been telegraphed now even by the mainstream media. I have been building up my China exposure, following the charts, not simply keeping tabs on the negative economic narrative. See my social media stream over the past few weeks to see what I’ve been buying. I am adding slowly, in steps due to the slowing in China.
Mueller Risk: To reiterate, I am an independent and for the purposes of investing, I could care less who the President is. I simply look at the risks to the markets should Trump be impeached OR removed, as a policy risk issue.
Mueller is still on the table as a risk to Trump tax policies, most importantly to the stock market, but even Cohen had nothing substantial to offer on collusion. That does not mean Mueller won’t however.
Oddly enough, the risk of impeachment went DOWN on existing evidence this week as some senior Democrats say they won’t pursue it on charges for which the Senate would not convict Trump. For example, for breaking campaign finance laws, normally there is just a fine for a breach of such laws, so removing a President on that basis would be viewed as political. Direct collusion with the Russians by Trump would be required to impeach and convict him. There is to date no public evidence of that.
2020 Election Risk: Read my comments from last week on this HERE. This is a risk that is present and will be rising as time passes toward the 2020 elections. Markets hate uncertainty, and the re-election of Trump is a great uncertainty.
Fed Rate Hike Risk: Rising! I said last week: “With the market already in full recovery as the Fed would view it, the risk of a rate hike is HIGHER now in my view.” Rates rose quickly off a higher low this week, and the jump looks like it will continue. The Fed is not done hiking in my view, which is completely non-consensus as virtually no one expects the Fed to hike rates. This is why I sold my long dated Treasury holdings for a profit on 2-11-19 (see social media posts). Yes, I walk my talk. And it’s why I sold nearly all of my gold/gold mining position on Friday, one day later than I would have liked. But I’ll cover that in the gold section below….
Let’s get back to the technical picture…
From Last Week: This still holds! “In my view, the SP500 Index would have to scale all THREE highs of Oct. 17, 2816.94, Nov. 7, 2815.15, and Dec. 3 2800.18, the latter just 8 points away, before saying the Mini Bear Market is dead” …or wounded. The close Friday? 2803.69. Above only the Dec. high.
GDP RISK: GDP surprised to the upside, proving once again that the Atlanta Fed does not know how to predict GDP. Nor do other private players who pretend to know, because there are too many variables to predict. GDP came in at 3.08% Year/Year, meaning it was up that much for the trailing one year period. The Quarter/Quarter SAAR GDP came in at 2.6%, 44% higher than the Atlanta Fed’s prediction of 1.8% and the NY Fed’s closer guess of 2.35%. Read more on the GDP report HERE.
At this link is Econoday’s Year over Year (Y/Y) Chart (Blue Line): U.S. GDP Y/Y (Blue Line) at Econoday.com. Note the progression of Q/Q results is not as impressive. Remember, it is the % Real (inflation adjusted) GDP change from the preceding quarter annualized, which is why the headline figure jumps around more than the Y/Y number.

Year over Year curve is OK, but the Q/Q results are slipping.
Get this! Now the Atlanta Fed predicts Q/Q SAAR Q1 2019 GDP to be 0.3% and the NY Federal Reserve says 0.88%! Now that they’ve proven themselves to be wrong countless times, will they finally simply by chance win the “Price is Right”!!!? They may as well run a show called “The GDP Number is Right” every quarter and have each Fed district play on live TV.
So what gives? If the Y/Y number is about to roll over as the comparisons to 2018 become harder, can the market simply look the other way and say “It’s transitory slowing”? I repeat the all important point that growth stocks are only going to work if they are actually growing their earnings on an inflation adjusted basis.
If costs start rising due to rising inflation, then only companies both insulated from inflation, with sustained earnings and revenue growth are going to prosper in the stock market from here. They will be the big winners, and we need to do our work to find them. Throwing darts won’t work going forward.
Take EVERY SINGLE STOCK YOU OWN and plug it in HERE at Yahoo Finance to see whether that is true for your company. Are earnings AND revenues going up for them in 2019 and 2020? Check your stocks! This is something we should do for all of our stocks EACH week to follow revisions, but it’s particularly critical when the economy is slowing around the world. Numbers keep being revised lower, and lower, and lower, week, by week, by week.
So how are earnings estimates doing for Q1 2019 after the first two months? BAD!
Look at the 3rd chart in the FactSet PDF HERE (it will pop up and it’s safe being a PDF), and you’ll see a DOWNTREND of earnings estimates as the SP500 Index RISES! This cannot go on forever unless these estimates are magically raised over the next four weeks due to the stupendous China deal/whatever. Since the SP500 Index overall has been doing badly in terms of these earnings estimates, be sure to CHECK YOUR OWN STOCKS!
Now take a look at the SP500 chart, and then we’ll review the earnings data, which are now 96% reported…. Orange lines are the 2017 up channel.
SP500 Large Cap Index (click chart to enlarge; SPX, SPY):
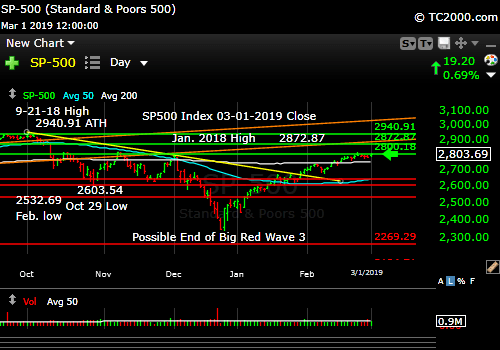
Stalling as earnings estimates fall.
This week, earnings predictions are AGAIN even worse, while revenues have been holding up for two weeks. That has to mean either companies are being forced to cut prices, or their input costs are rising, or both. Check these possibilities out for the stocks you own. The full FactSet report is HERE, and this is their site.
These are the SP500 Index Earnings and Revenue growth (or lack thereof) numbers predicted as of the Feb. 2nd vs. the Feb. 15th vs. the Feb. 22nd vs. the Mar. 1st close by FactSet, from left to right…
“For Q1 2019, analysts are projecting a decline in earnings of -0.8% -> -2.2% -> -2.7% -> -3.2% and revenue growth of 5.7% -> 5.3% -> 5.2% -> 5.2% .
For Q2 2019, analysts are projecting earnings growth of 1.6% -> 1.0% -> 0.7% -> 0.3% and revenue growth of 5.1% -> 4.7% -> 4.7% -> 4.8%.
For Q3 2019, analysts are projecting earnings growth of 2.7% -> 2.4% -> 2.2% -> 1.9% and revenue growth of 4.9% -> 4.5% -> 4.5% -> 4.6%.
For Q4 2019, analysts are projecting earnings growth of 9.9% -> 4.8% -> 4.5% ->4.1% and revenue growth of 6.0% -> 4.9% ->4.9% -> 5.1%.”
FactSet says…“For CY 2019, analysts are projecting earnings growth of 4.1% and revenue growth of 5.1%.” That seems a stretch for earnings growth, given the numbers above, does it not? They believe the energy and communications sectors of SPX will rise the most in price over the next year. These two sectors surprised analysts the most for the Q4 2018 results with beats of 12.9% and 8.2%, respectively per FactSet.
Maybe… But as I said last week,
“This deterioration ‘should’ put the breaks on the market prior to making new highs (for SP500 Index) above those three prior lower highs given above.
If not, the market will be sending a strong message (right or wrong) it intends to move still higher.“
This key pivot point is now noted in the mainstream financial press. (Everyone now sees the 3 prior tops vs. where we are….) My strategy? Buying if the market can take out all three prior SP500 Index tops, and letting go of that exposure with a fairly tight stop should it move back below in a fake-out move. You may want to take that loss if you are going to buy if the breakout occurs, and you also want to trade it more aggressively. Or, alternatively, if your time horizon is long, you may simply choose to hold the new exposure and add again even lower. We SHOULD see confirmatory volume on such an up move in the SPX. If not, it could be a fake-out. Watch for that…
Now let’s check in on two “Canary Signals” we’ve been following:
“Intel-igent Market Timing Signal” (Intel; INTC): Very positive. Bulls can say “Semis run the world, so how slow is the world going to be if there is a big semi rally led by Intel?” There was no “island reversal.” Yet, the stock has gone sideways for the last four market days mimicking the overall market. A decision on the market’s direction is imminent.
For now, the uptrend in Intel is intact…
Bank of America (BAC) Market Timing Signal: Negative. It has gone nowhere since 1-18-2019. This lack of response does not confirm the higher rates we saw in the market over the past few days by the way, which is why the TNX move COULD reverse. Read this again from last week….
“Remember the problem for the entire market:
- If the economy is getting better, rates generally should rise, at least over the short term, not fall.
- The market believes the Fed will go slower on hiking rates, because the global economy is slowing! That means rates would fall, not rise.” There were two more points made after this one…(find them at the link to last week’s issue to the upper right).
The Only Way UP!
The SP500 Index will either…
- Break out to new highs with SLOWLY rising (added 3-16-19: OR stagnant) interest rates. This is the ONLY way UP for the U.S. stock market.
- Fall back to at least the October 2018 low or worse on RAPIDLY rising interest rates (which I will then call Rate Shock III).
- Fall back to at least the October 2018 low or worse on FALLING interest rates as the market begins to realize the economic slowing is real and as estimates of earnings continue to fall.
That means there are two bad routes for the stock market, each portending a potential 7.14% drop (to Oct. 2018 low) or worse, and one path to success. Those who think the economy is going to be accelerating with stocks rising, without inflation, and the Fed LOWERING rates are delusional. Rates will optimally rise slowly and the Fed will optimally hike rates slowly…
Now let’s go on to review investor sentiment and why it confirms this as a key pivot point…
Keep up-to-date during the week at Twitter and StockTwits (links below) where a combined 33,889 investors are following the markets with me…
Follow Me on Twitter® Follow Me on StockTwits®.
Join the Conversation in the StockTwits “markettiming” Room
Survey Says! Sentiment of individual investors (AAII.com) showed a Bull minus Bear percentage spread of +21.63% vs. +13.93% last week. Every one is as cheery as they’ve been since the high in the market on Oct. 3, 2018, a high just shy of the all time high on 9-21-2018. The spread was 23.1% on 6-13-18 at a temporary high in the market followed by a pullback of only about 3.5%. That was in the middle of a long recovery back toward a brand new all time high. Sound familiar to the Bulls out there? It could happen again yes, and, yes, there is plenty of room for more sentiment upside.
And no, 20% Bears is not a key number. That was seen (20.58%) on 5-16-18 and the market pulled back only about 1.7%. This means the current sentiment IF we can make it over the prior lower highs noted, can continue on up and support a further rally. You cannot use sentiment alone to trade. Only when truly extreme is it of major value, as it was in January 2018 before the market dropped precipitously. I reported that data here as those of you who are long time readers know.
CONCLUSION on SENTIMENT: Sentiment is at a level that could point to a pullback, but it does not have to be a big one. If the market moves higher, sentiment could also move higher, so the key is to follow the direction of the next critical move in relation to the prior THREE LOWER HIGHS in the SP500 Index.
| Bulls | Neutrals | Bears |
| 41.63% | 38.37% | 20.00% |
| Thurs. 12 am CT close to poll | ||
2. U.S. Small Caps Market Timing (IWM): Stalled out barely above the 200 day moving average. Remember this is high beta, so you will be hurt more than in large caps should the triple top become a quadruple top.
Russell 2000 U.S. Small Cap Index (click chart to enlarge; IWM, RUT):

Stalled out. Waiting for a decision…
3. Gold Market Timing (GLD): I dropped my exposure in terms of GLD and miners from 5.3% of investable assets to around 3.9%. I could have kept the exposure at 5%, which is my normal “insurance” target for gold holdings, but I did not.
I said last week: “Realize any big jump in interest rates could knock down our profits. At some point, protect your profits as it’s been a good trade, but be willing to get back in if you are wrong on any exit.” I could have been at least a day earlier, but hesititated, which was wrong. When you see what you see, do not hesitate. Trade your own plan.
I will be back quickly to 5% gold exposure if I’m wrong, but what I saw on Friday was:
1. A big volatility spike with a large move by GLD by 1.70% to the downside on Friday (as well as GDX -2.43% etc).
2. a. This happened as rates shot up over a 3 day period to an extent that challenges the current 10 Year Yield trend and the view that the “Fed went dovish.”
It did not. Not really. They just became less ignorant about global slowing. The Fed went neutral and is watching and has one game left as I’ve harped upon, but the mainstream press does not understand. They have only inflation to fight from here. Employment is NOT an issue. That means they will hike if they have to to contain the rising Core PCE Inflation index at a certain level. It was at 1.9% Y/Y on Thursday. Their target is 2%. They say they may let it slide up a bit more, but we’ll see. Asset prices are reinflated to levels barely below the prior high for the SP500 Index. They have no worries about U.S. investors being sad any longer. 😉
2. b. The rate rise means higher real rates, if inflation is relatively subdued as Treasury yields rise. Gold HATES that combination. Why? Because gold HATES rising real rates beyond all else. Read my article on what gold hates and loves HERE. I can say confidently “It is worth gold!”
The Gold ETF (click chart to enlarge the chart; GLD): Look at that obvious breach of the uptrend line….
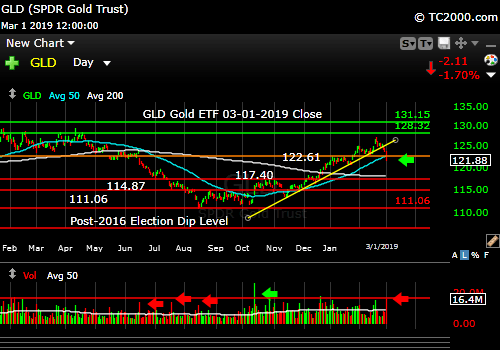
Gold hates rising rates and they are attempting a new up trend.
4. Interest Rate Market Timing – U.S. 10 Year Treasury Note Yield (TNX):
I DID bail on long dated Treasuries on time (no need to sell short dated Treasuries out a year or so; just let them mature and extend your ladder forward in time). OK, we’ll see what the next week brings, but for now, my sale of IEF and TLT on 2-11-19 from the lower high was just about perfectly timed. I did not hesitate, despite all media talking the opposite way.
I wrote in a prior post: If so [the Fed is now dovish], why are rates barely lower than when they concluded that, which was at a TNX of 2.688%? SOMEONE IS WRONG ON RATES! That is why I’m standing clear until I see the next big move, and sticking with short term Treasuries (see last week’s post on what I actually did!).”
TNX closed Friday at 2.755%, above that 2.688% “the Fed’s gone dovish” number. If rates break to the next level, you can make money on following the new trend. Yes, there is one more level to be taken out to confirm my impression and turn this nascent uptrend into an obvious uptrend. Follow me on social media (links above) to learn when this happens.
Remember: Rates are still ridiculously low for a strong recovery scenario.
Check out the “Market Signal Summary” below – after you review the following chart…
U.S. 10 Year Treasury Note Yield (click chart to enlarge; TNX, IEF, TYX, TLT, TBF):
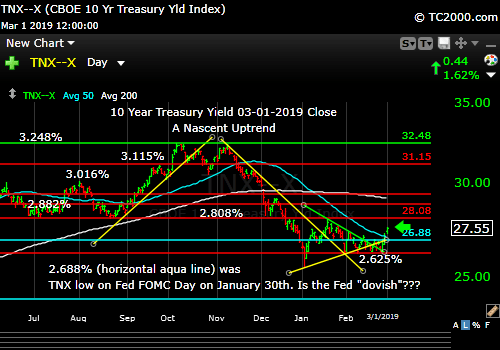
Rates rising in new uptrend or just another fake-out blip up?
Now let’s review three key market timing signals together….
Do not use these signals as a trading plan. They are rough guidelines. I currently share my own moves on social media (links above).
MY MARKET SIGNAL AND TREND SUMMARY for a Further U.S. Stock Market Rally with Real GDP Growth (“Real” means above inflation):
Stock Signal GREEN for a further U.S. stock market rally with a Bullish SP500 Index trend. (signal here is based on small caps)
The V*IX (which relates to SPX volatility; * added to symbol to throw off the webcrawlers!) closed at 13.57 vs. 13.51 last week, which correlates with the lack of progress this week for the Bulls.
The Bears have lost ALL prior 7 targets: 14.04-14.08, 15.04, 15.94-15.95, 16.09, 17.06, 17.27, and 17.89 (updated 3-02-19). The Bulls are approaching a big Bullish number….
The ‘Bull Nirvana Target’ is our V*IX # of 2018: 13.31.” (That # is target #8.) This is not a guarantee for more gains, but it’s one goal the Bulls must attain.
Gold Signal NEUTRAL for a further U.S. stock market rally with a BEARISH Gold Trend. The uptrend is broken and rates are rising. Those are Bearish for gold. What gold does mostly as I’ve written HERE is follow real interest rates. LAST WEEK: “If we see rates break lower, gold will keep trending up. If not, there will be trouble ahead for all metals.”
From before: “Remember GLD is being used as an indicator for the ECONOMY here.” If gold continues to rise, it means the market believes real rates will fall, which means the global economy is slowing. That would hurt U.S. stocks.
Rate Signal NEUTRAL for a further stock market rally with a nascent BULLISH 10 Year Yield Trend. Follow the move. I call the signal “Neutral,” because rates can move up a little if they move slowly and don’t rise too high. With a slowing economy at present, higher rates are not a positive.
I said weeks ago, “Watch the oil price too. Higher oil tends to mean higher rates.” Oil is having trouble getting above the Feb. high over the past week, but unlike gold, there is no breach of the uptrend…yet. Oil was down on Friday, while XLE was UP.
I previously warned about the Fed tightening process: “This level of the 10 Year Treasury Yield, which is too high for current conditions as explained HERE, will eventually slow the economy.” I said, “2.621% was the peak back in 2017 when stocks did best. Anything below that would be an improvement.” The close on Friday? 2.755%! Higher rates only work in a strong economy, NOT a slowing U.S. and global economy. Global economic growth had better pick up fast!
As for much higher rates and their possible impact, I said previously: “All heck would break loose for equities if TNX lurches above 3.248%, particularly if the rise is rapid. Buy long dated Treasuries as close as you can to 3.248% on the 10 Year Yield TNX (IEF, TLT, etc.).”
Watch the rate at which TNX climbs. If it shoots up very fast, stocks will correct. In the Sept. 28th issue: “A rapid push higher in rates would mean trouble for stocks, as occurred in early 2018. That’s what I called ‘Rate Shock.'” The period of rising rates in early October I called #RateShockII.
Thank you for reading. Would you please leave your comments below where it says “Leave a Reply”… or ask a question or report a typo…
Pay it forward by sending the link to MarketTiming.Blog (that link will immediately connect them to this webpage) to a relative or friend. Thanks for doing that.
Be sure to visit the website for more general investing knowledge at:
Standard Disclaimer: It’s your money and your decision as to how to invest it.
I thank Worden Brothers for the charting system I use to post these charts. If you want to know more about the charting system I use every day, go HERE. It makes it much easier to follow along with me if you can see the charts and manipulate them on your own computer. It’s a great investment to have an excellent charting system. Check it out with a free trial at the link above. I am an affiliate of Worden Brothers, though oddly I’ve never been paid a cent by them. If you HAVE subscribed to their service, please send me a message. 😉
Note: I’ve updated my criteria for the equity signal for a further U.S. stock market rally to the following: GREEN = Bullish, YELLOW = Neutral, RED = Bearish. In other words, the colors tell you whether the signal supports the stock rally or not, while the Bullish, Neutral, and Bearish designations are about the trend.
A BEARISH trend signal does not mean we should not buy. A BULLISH trend signal does not mean you cannot sell some exposure. It depends on what is going on in the economy and how oversold/overbought the market is at a given point whether the Bearish signal is to be sold, sold on the next bounce, etc. and whether a Bullish signal is to be bought or if profits should be taken. A NEUTRAL trend signal does not mean the end of the Bull or Bear. It means to wait and look for possible subsequent entry points within the existing trend, Bull or Bear, but preserve capital if the entry fails. Our strong intention is to buy low and sell high. By the way, I will keep showing the prior orange “Trigger lines” in the charts for now as reference points only; they have historical value for us from the post-2016 election period.
Copyright © 2019 By Wall Street Sun and Storm Report, LLC All rights reserved.

this is great! thank you for sharing your work – very noble of you!!
You are welcome!
Survey Says! Sentiment of individual investors (AAII.com) showed a Bull minus Bear percentage spread of +21.63% vs. +13.93% last week. Every one is as cheery as they’ve been since the high in the market on Oct. 3, 2018, a high just shy of the all time high on 9-21-2019. The spread was 23.1
TYPO: I think you intended “ 9-21-2018 “ instead of 2019
Great brief! and the “time horizon” language and other information there is very informative for investors unchecked emotions when they are wrong short/long term!
Fixed. Thanks for your comment Charles!